1. Introduction
Economics instructors must juggle theory and application to best teach the concepts of each course. Part of what makes economics a powerful subject is its leverage of mathematics and its development of critical thinking skills. Although mathematics use is a huge advantage for students entering the workforce, mathematics is also one of the hardest hurdles for students. Students see and are taught how to manipulate graphs in class but often struggle to apply them once they get to homework and exams. Interactive software helps bridge this gap, but homework software is often expensive. The objective of this paper is to inform economics instructors about GeoGebra, including some examples and applications, advantages and disadvantages of the program, and possibilities and limitations of its implementation.
GeoGebra is a versatile mathematics program that tackles both the issue of affordability and the need for quality interactive exercises and assignments. While GeoGebra has been used extensively in mathematics education (Juandi et al. 2021; Zhang et al. 2025), its application to economics education is just emerging (Galicia et al. 2018, 9529–9534; Milenković and Vučičević 2024; Warsitasari and Rofiki 2024). This paper provides examples of how the tool can be used for economics pedagogy, identifies the benefits and costs of this tool for economics instruction, and—in the teaching notes—provides tutorials on building and implementing activities.
Three activities described in this paper have been implemented in the author’s Principles of Economics course, both in asynchronous online and in-person modalities embedded in various interactive workbooks within Canvas, covering topics related to supply and demand, perfect competition, and inflation. These activities, updated regularly, have been used in the author’s classes from Fall 2023 to the present. The interactive workbook acts as one form of the students’ homework. Similar activities using GeoGebra Classroom have also been incorporated into in-person class sessions, allowing students to see their work in real time.[1] These activities, while first utilized as homework, are also appropriate for in-class use.
2. Background. What Is Geogebra (Classic)?
GeoGebra is an applet-based dynamic mathematics software that allows for the use of graphing, algebra, spreadsheets, calculus, statistics, and more in one engine (GeoGebra 2025). Its platform contains no-additional-cost classroom resources created by the GeoGebra community. GeoGebra is open source and freely available for non-commercial users. There are many different GeoGebra math apps on the platform itself, but the one that is the most powerful for economics seems to be GeoGebra Classic,[2] which is the focus of this paper. For those interested in a comparison of the GeoGebra math apps and their differences, this page provides a guide (u/geogebra+docu+team 2018).[3] Given the prominence of graphing, spreadsheets, and statistics in economics, GeoGebra Classic is a tool appropriate for most economics applications.
Limited research has been done into the use of GeoGebra in economics education (Galicia et al. 2018, 9529–9534; Milenković and Vučičević 2024; Warsitasari and Rofiki 2024). Much of the research is from conference proceedings, with a few journal articles. However, the underlying sentiment about GeoGebra in economics is that it is an effective tool for visualization, problem solving, and developing logical reasoning skills.
2.1. Motivation. Why Use GeoGebra?
A professor’s choice of materials and assessment tools forms the foundation for a given course. Within these choices, professors often face tradeoffs between affordability, accessibility, interactivity, and overall quality of materials and tools. Over time, the cost of learning materials has risen and for some students has become prohibitive, causing them to forgo purchasing course materials at all (Spica and Biddix 2021). When this issue kept surfacing, the author began searching for affordable alternatives for assessment that preserve quality. Table 1 in the appendix compares a representative sample of the instructional and assessment tools available, both proprietary and open source, for introductory economics courses.
The examples in Table 1 divide the different assessment software options into two main categories: software connected to a course textbook (e.g., MindTap, Connect, MyLab) and standalone software/webpages (e.g., GeoGebra, Desmos, EconGraphs). Many assessment tools linked with textbooks are moderately customizable with variable interactivity. However, access to these tools is limited (semester to a year) and prices range from about $81 to $191, with the textbook included. The standalone software/webpages listed are examples that are affordable and sometimes customizable, comparable to GeoGebra and other open-source economics assessment tools.
GeoGebra is highly customizable, has unlimited access for students (as long as the professor keeps the activity available), and is highly interactive. The software most comparable to GeoGebra is Desmos, a viable alternative. Both GeoGebra and Desmos are primarily used in mathematics education, with limited use in economics. Depending on the relevant application, GeoGebra or Desmos will be preferred. GeoGebra allows for more scripting options, full graphing capabilities, and offline access. This paper focuses on GeoGebra, the software the author has utilized that provides one open-source option for economics instructors interested in making dynamic activities for students.
GeoGebra is affordable due to its open-source nature, and it is widely accessible (GeoGebra 2025). In an era when college affordability is a significant concern, many students avoid purchasing required course materials, as the cost of textbooks, homework software, and more can be prohibitive. According to the National Course Materials Survey from Bay View Analytics (2023), 7 in 10 students are worried about meeting their course material costs.
GeoGebra has no additional explicit cost, making it attractive to educators trying to keep costs down. Instructors often face a tradeoff between affordability and materials and tools that enhance student learning. The initial motivation for using GeoGebra was to find an affordable tool for creating interactive homework, but its versatility and level of customization make it comparable and sometimes superior to software students purchase, while also being affordable. Additionally, since it is not linked to a particular textbook, instructors can select course materials that best fit their students’ needs and their own preferences without being restricted to textbook software. For example, if the instructor utilizes open-source course materials and uses GeoGebra, students would have no additional out-of-pocket cost for their economics course.
Given the mathematical nature of economics and students’ struggles with applying and interpreting graphs and other mathematical tools, having a more interactive tool is beneficial. While paper-based homework is helpful for many reasons, grading costs may discourage its use. GeoGebra can grade graphs and other mathematical problems quickly, reducing grading time, especially in larger classes. This is less of an issue for instructors who utilize online homework software that automatically grades questions. However, this software can be costly for students, so GeoGebra provides an alternative that is faster than manual grading and more affordable.
There is evidence of a positive impact on student achievement using GeoGebra. While research on GeoGebra’s use in economics education is lacking, there has been extensive research into its use in mathematics education (Tatar and Zengin 2016; Zulnaidi and Syed 2017; Abadi and Fardah 2018; Albano and Iacono 2019; Misrom et al. 2020; Birgin and Topuz 2021; Ndagijimana et al. 2024). Several meta-analyses of GeoGebra’s impact on student mathematical achievement demonstrated a medium to large positive effect on achievement (Juandi et al. 2021; Zhang et al. 2025). There was also enhanced understanding of topics like geometry, calculus and functions, and problem solving (Tatar and Zengin 2016; Zulnaidi and Syed 2017; Abadi and Fardah 2018; Albano and Iacono 2019; Misrom et al. 2020; Birgin and Topuz 2021; Ndagijimana et al. 2024; Warsitasari and Rofiki 2024). Given the mathematical nature of economics and the benefits of GeoGebra use in mathematics, it is likely that GeoGebra can be a beneficial tool for economics education.
Evidence from mathematical education supports increased interactivity and engagement from the use of GeoGebra (Abadi and Fardah 2018; Radović et al. 2020; Selvy et al. 2020; Yohannes and Chen 2023; Ndagijimana et al. 2024; Zhang et al. 2025). Some studies suggest that it boosts self-confidence and self-esteem and encourages participation (Takači et al. 2015; Zulnaidi and Syed 2017; Nasrullah et al. 2023; Ndagijimana et al. 2024). Additionally, there is evidence that GeoGebra promoted self-regulated learning during the Covid-19 pandemic (Ishartono et al. 2022).
Instructors face pedagogical choices about how to allocate class time to optimize learning. There is a delicate balance between lecturing, group work, and other interactive activities. GeoGebra has been implemented in several different pedagogical approaches, such as constructivism and problem-based learning (PBL) (Takači et al. 2015; Tatar and Zengin 2016). Overall, studies suggest that GeoGebra improved logical reasoning, especially when linked with PBL and economics (Misrom et al. 2020; Warsitasari and Rofiki 2024). There was also greater development of students’ higher-order thinking skills, and students retained learned material better using GeoGebra. Improved learning outcomes suggest that sacrificing lecture time for PBL is a worthwhile tradeoff.
GeoGebra excels in small group, collaborative learning environments (Takači et al. 2015, 426). Instructors who are reluctant or new to small group activities in class may find GeoGebra a helpful tool. Several studies suggest that in GeoGebra-supported learning environments, the instructor’s role shifts from direct instruction to guide and facilitator, encouraging students to explore and learn with their peers (Zulnaidi and Syed 2017; Birgin and Yazici 2021; Yohannes and Chen 2023; Özcan and Zengin 2024). GeoGebra has also been effectively implemented in flipped classrooms in a 5E-based model (Ishartono et al. 2022; Özcan and Zengin 2024).
While GeoGebra is a powerful tool, it is not without its challenges and limitations. There can be technological barriers in terms of internet connectivity issues, instructors lacking understanding of technology, and a lack of technological infrastructure and support (Manganyana et al. 2020; Mthethwa et al. 2020). GeoGebra can also add to cognitive load since students can only process a certain amount of information at a time, and the use of multimedia can be distracting for students (Takači et al. 2015). Although most studies on the effectiveness of GeoGebra were positive, they often had small sample sizes, short intervention durations, and non-random student samples, making them less reliable and generalizable (Mthethwa et al. 2020; Birgin and Topuz 2021; Birgin and Yazici 2021; Ndagijimana et al. 2024).[4]
GeoGebra’s customizability benefits instructors in many ways. First, instructors can tailor assignments and exercises to their class and the needs of their students. Second, having unique assignments can potentially reduce free-riding and academic dishonesty. Third, giving students unique problems often encourages students to take more initiative in seeking help from the instructor and their peers. Finally, GeoGebra can be embedded in larger activities and projects, enhancing its versatility. For instructors interested in a versatile open-source tool for classroom use or assessment, GeoGebra is a great option.
3. GeoGebra Applications
The main examples in this paper are from an interactive workbook created as a form of homework assignment. The workbook involves several GeoGebra activities, multiple-choice questions, short answer questions, and more, implemented in GeoGebra and Canvas. Within the workbook, students base their work on a hypothetical/imaginary business they create within an assigned industry. Students base GeoGebra questions on their hypothetical business and the product ideas they have. Each student has their own business ID based on their industry type. Although the activities described below are related to the workbook, the tool and the GeoGebra activities described here can easily be implemented within classroom exercises such as cases and more.
The workbook was first implemented in the author’s Principles of Economics course in Summer 2023. The activities described below have been used every semester since Fall 2023, in a variety of course sections delivered both online and in person. The course is a core course for majors in Business Administration and Financial Services at a private liberal arts university. It is taken by majors and non-majors across the campus, primarily by business, engineering, and pre-law students. Class sizes are typically 30–35 students with up to three sections per professor. Although this was implemented at a school with smaller introductory class sizes, it could be adopted at larger universities that employ smaller recitations and teaching assistants.
In the large lecture environment, for example, instructors could use an activity and display a subset of student work on the screen to illustrate a case instead of circulating to every group or individual student, which is impractical in that setting. A limitation for larger classes is that customization for more students may cause the program to run more slowly.
3.1. GeoGebra Application: Supply and Demand Activity
The first activity we examine uses GeoGebra to help students learn supply and demand analysis. As a core topic within principles of economics courses, this activity helps students understand how curves shift and the ultimate impact on the equilibrium price and quantity. Complex shifts where both curves shift can be hard for students to visualize and apply to specific examples. Through this activity, students practice with the determinants of supply and demand to see how they impact the curves and the equilibrium.
In this example, the student’s imaginary business is in the apparel industry, the student belongs to course section A, and they are student number 2. This populates a unique business ID shown in the corner that can be used to identify students and assist grading. The activity is set up to accommodate 80 students, but the number of sections, industries, and students can be expanded; the author has tried 120 students without issue.
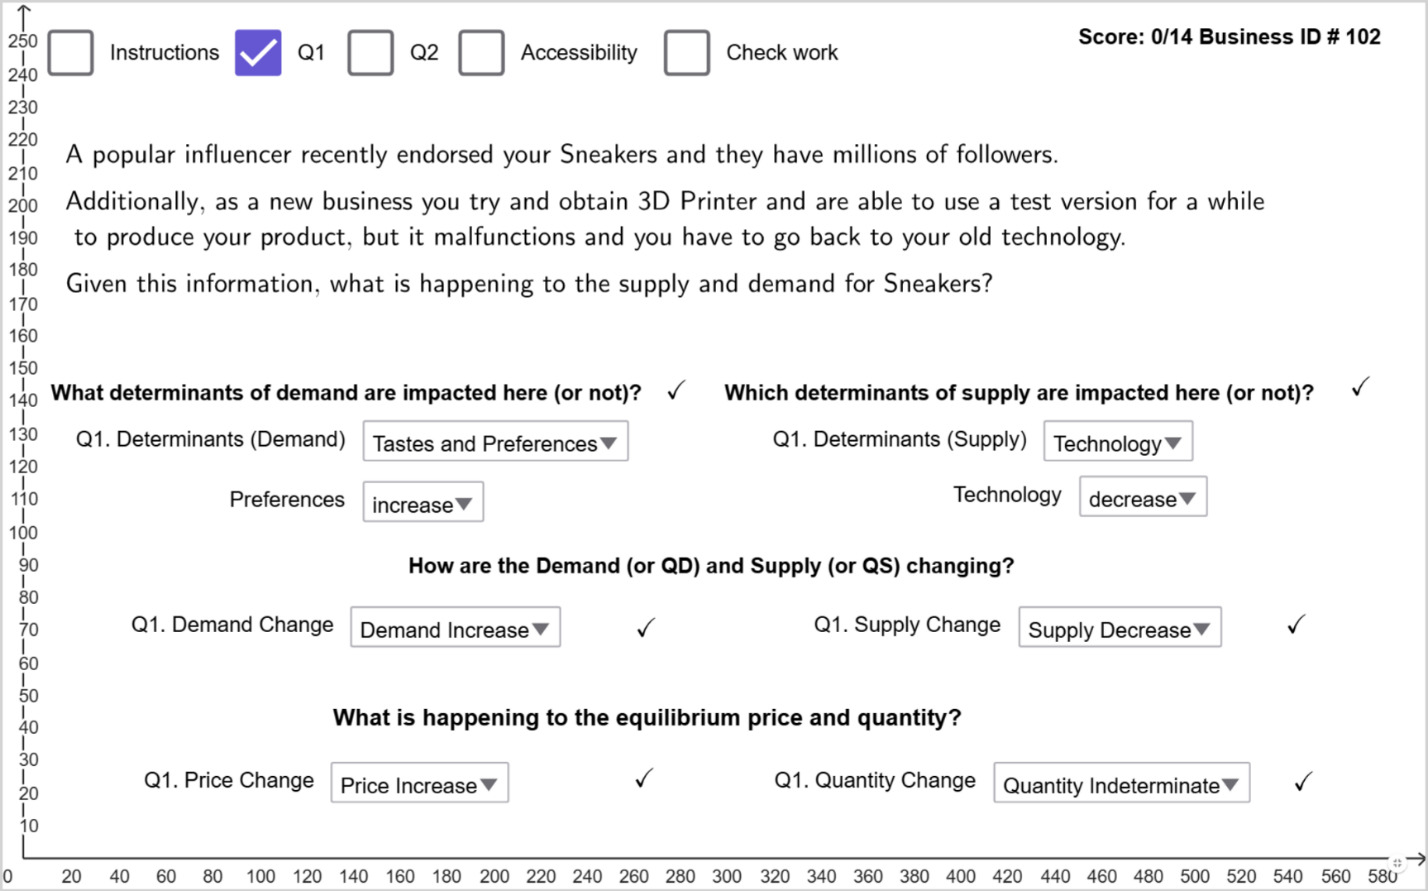
The student in Figure 1 has created a sneaker business and treats running shoes as a substitute and socks as a complement for their product. The student suggests that 3D printers are a type of technology that could help make sneakers.

Moving to the first question shown in Figure 1, here students need to identify whether the demand and/or supply curves are shifting, and how. Focusing on the demand curve, the prompt suggests that a popular influencer recently endorsed the student’s product. The student would then need to determine how that influences the demand curve. Since the influencer would positively impact demand, tastes and preferences would increase and demand would shift to the right. Students struggle to differentiate between a change in demand versus a change in quantity demanded. Additionally, they often confuse which curve is shifting and why. The goal of this first section, Q1 in Figure 1, is to have students recognize these shifts, or lack thereof, based on their unique prompt. Students also often fail to recognize the impact on the equilibrium price and quantity when both supply and demand shift simultaneously. The idea that either price or quantity could be indeterminate is examined in Q1 but reinforced in Q2 after they see the shifts in practice.
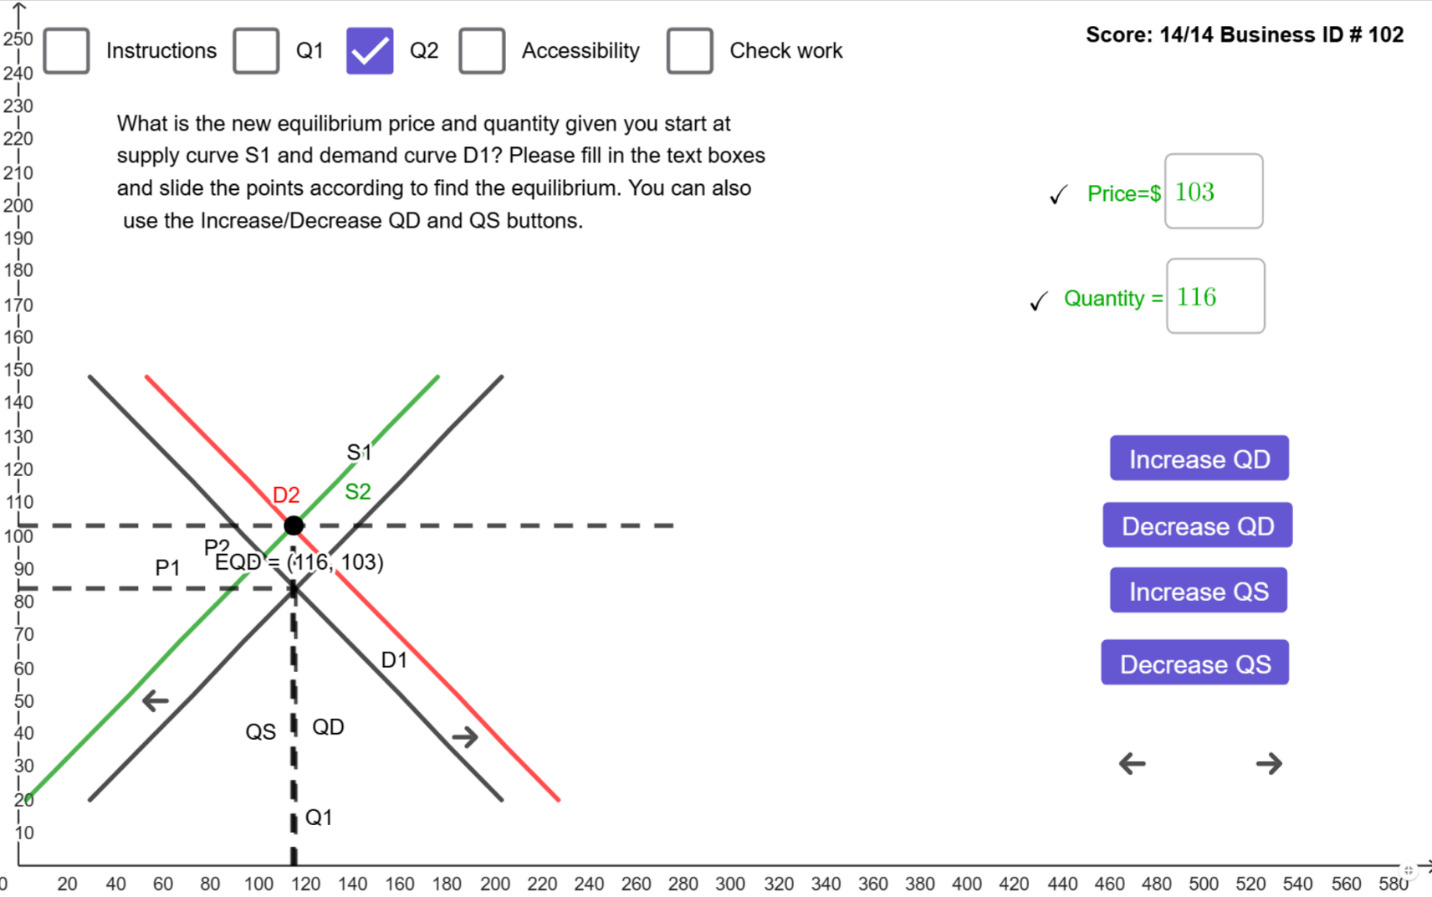
Figure 1 shows what the answer looks like once all demand and supply shifts have been factored in. Since demand shifts right and the supply curve shifts left, the equilibrium price increases, but the effect on quantity is indeterminate. In this case, the quantity is indeterminate because supply and demand shift in opposite directions, and no information is given about the relative magnitude of the shifts. If desired, instructors can construct more detailed scenarios that allow students to determine the effect on quantity. In Figure 2, the student demonstrates the new equilibrium price and quantity graphically along with the values they correspond to in the input boxes.
_solved.png)
Question Q2 in Figure 2 is implemented to help students struggling with graphing and identifying equilibrium values. Not only must students correctly locate the equilibrium points, but this example also reinforces situations where price or quantity outcomes may be indeterminate. For example, an instructor might give two students the same prompt but, through GeoGebra, have the magnitude of the shifts of supply and demand differ and illustrate how, without more information, quantity is indeterminate.
Something unique to this example is that students need to slide the points on the demand and supply curves to find the equilibrium price and quantity graphically. The only way to get the correct quantity in the input box is for it to match what the student selects on the graph. This is done to ensure that students recognize that the numbers they enter in the input box need to match what is found on the graph, since they represent the same thing.
3.2. GeoGebra Application: Perfect Competition Activity
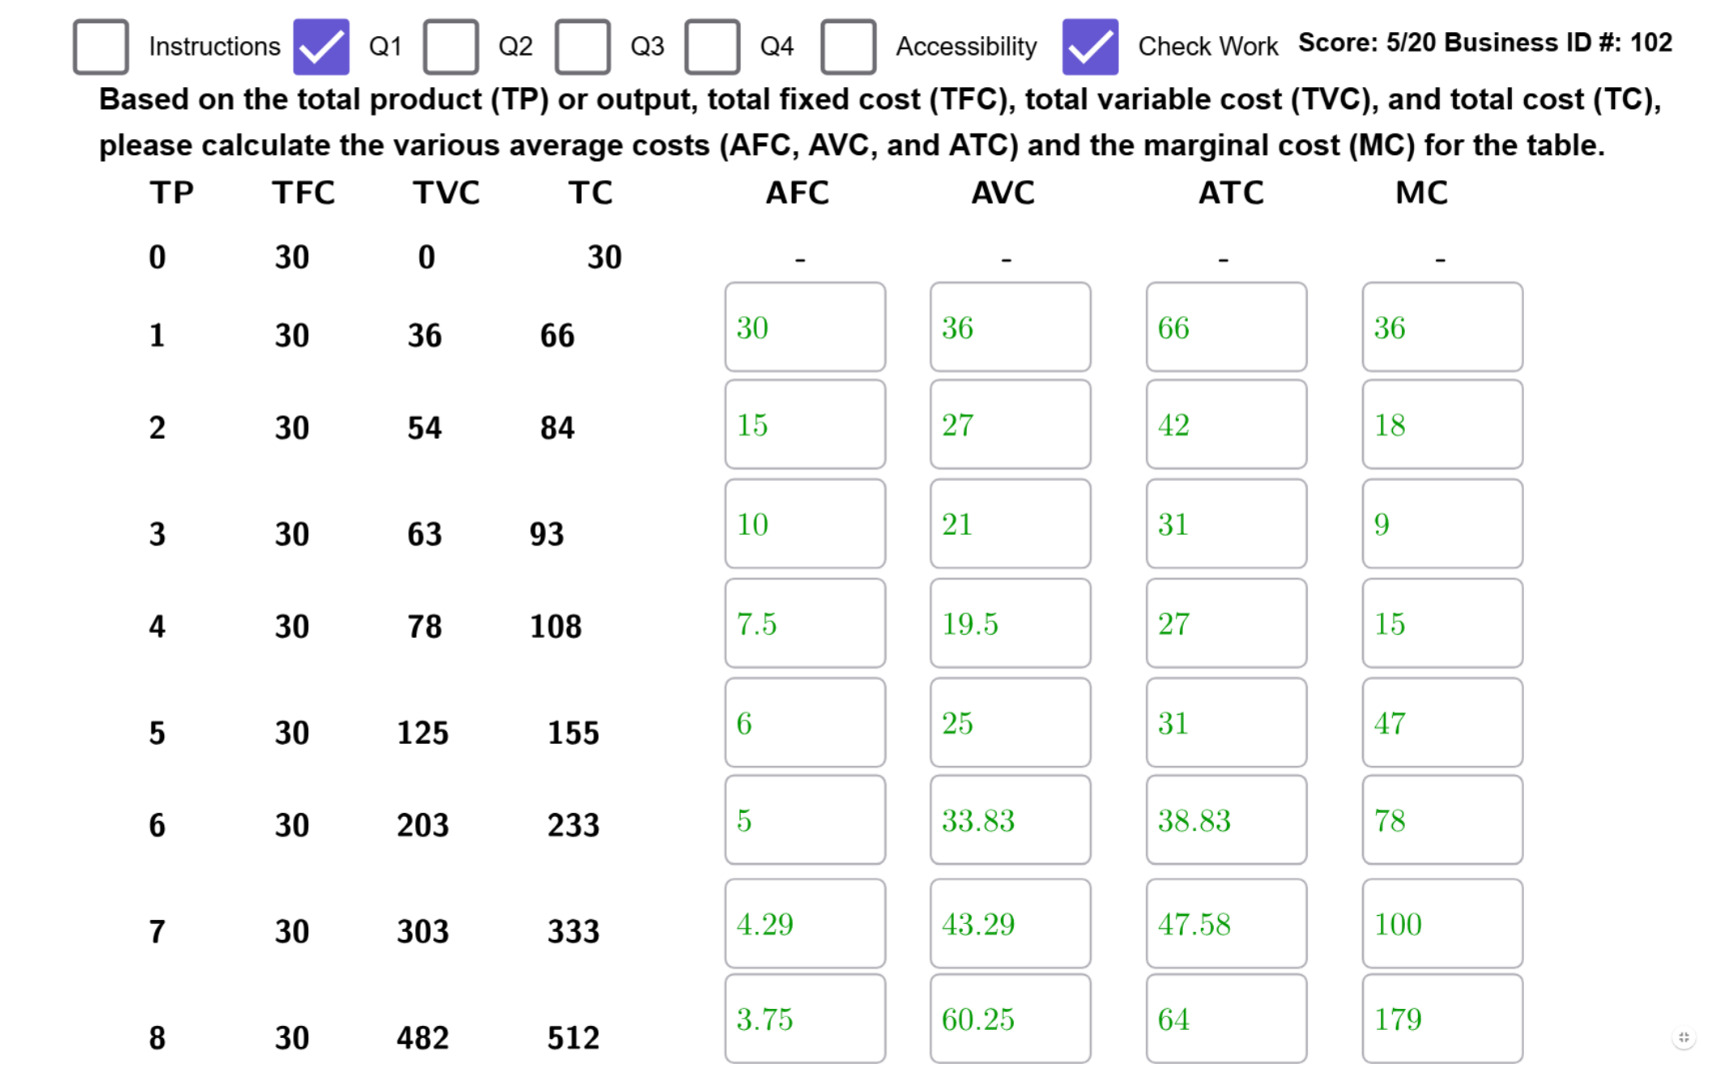
In building the theory of the firm, we typically introduce students to the cost side first. Students often complete tables like the cost table found in Figure 3. Tables like this can be built using input boxes or using the spreadsheet tab in GeoGebra. The graphs and tables were created using the spreadsheet view in GeoGebra, which is not visible to students in this activity.
_solved.png)
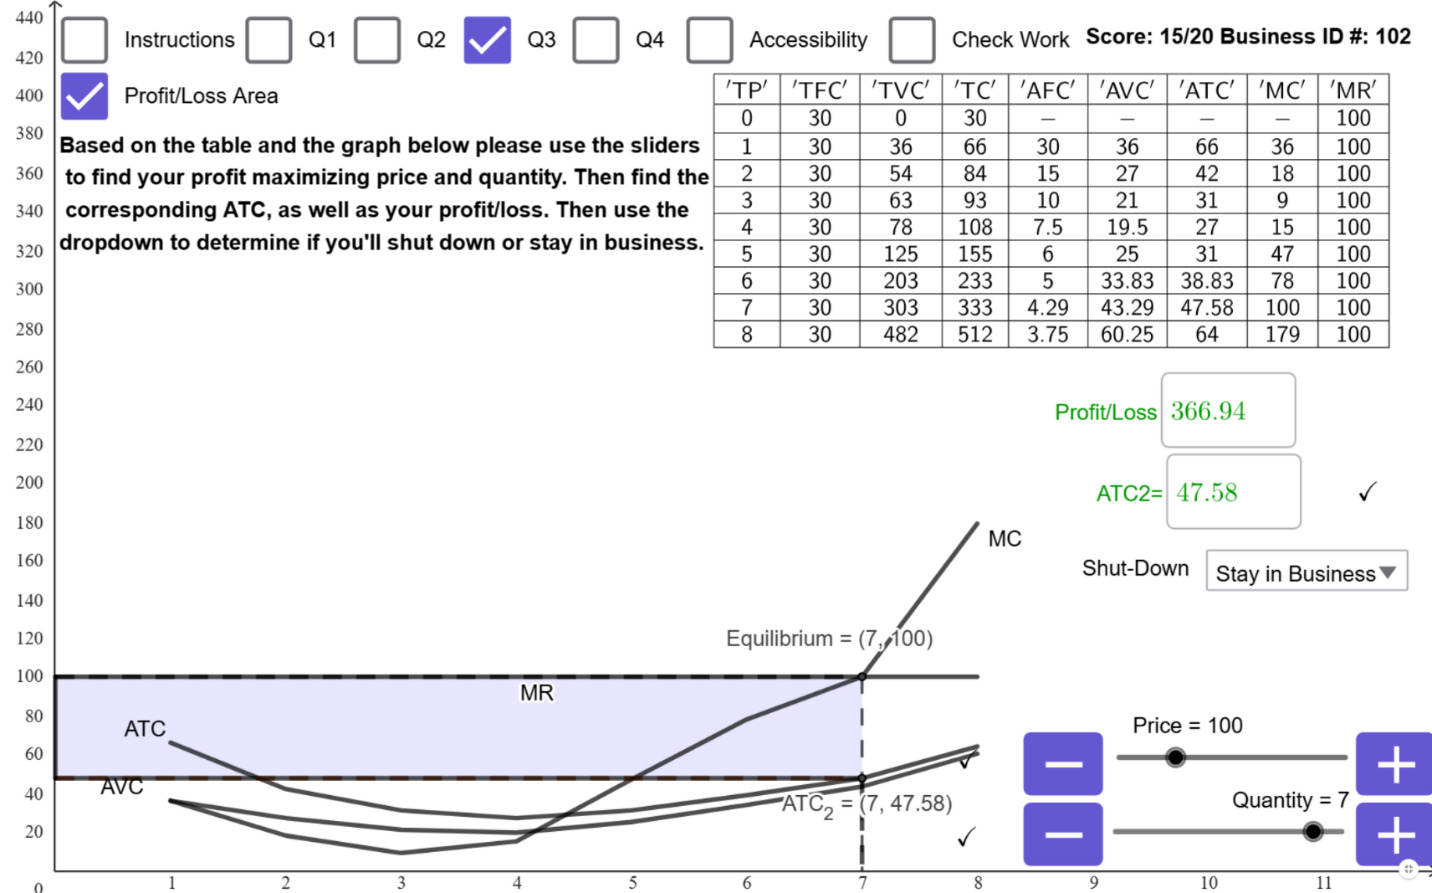
This activity is designed to help students understand how to calculate cost schedules and see how these become the cost curves used in our perfect competition graph. These tables help students understand the difference between the calculation of total, average, and marginal cost. In Q2–Q4, students are given various prices the perfectly competitive firm faces in the short run. From there, students determine what happens to the price, quantity, ATC, profit/loss, and what the firm will decide to do in each scenario.
The second objective of this activity is to reinforce understanding of firms’ short-run decisions when they earn a profit, suffer losses but stay in business, and shut down in the short run. In the shutdown scenario, students will often find the quantity quickly but get confused when the profit-maximizing quantity is zero. This activity illustrates the difference between the shutdown condition and when the business should continue producing in the short run. Students also get confused by the fact that ATC is undefined when or that the profit equation fails to work. Students must then recognize that they will lose the amount of their fixed costs when they shut down. An interesting observation of students’ use of AI tools is that they can struggle with problems like these because the AI tool will get stuck in the same logic the students do. This means the student needs to think critically to determine the solution or take the initiative to ask for help, while helping reinforce the limits of AI.
The table the student fills in Q1 populates the table in Figure 4. The table they fill in also creates the graph used in questions Q2–Q4 in Figure 4. Students then answer questions in Q3 based on the table they created in Q1. To understand what is happening in Q3, one needs an accurate table in Q1. In Q3, based on the table and graph, students use sliders to determine the correct price and quantity. By building the graph and sliding points along it, students apply what they learn about cost and MR curves, determine the optimal price and quantity, and locate the corresponding ATC. Students can even toggle the “profit/loss” check box to visualize the area corresponding to profits or losses and help associate the profit/loss equation with where it is represented in the graph.
_calculating_profits_and_losses__selecting_the.png)
3.3. GeoGebra Application: Inflation Activity
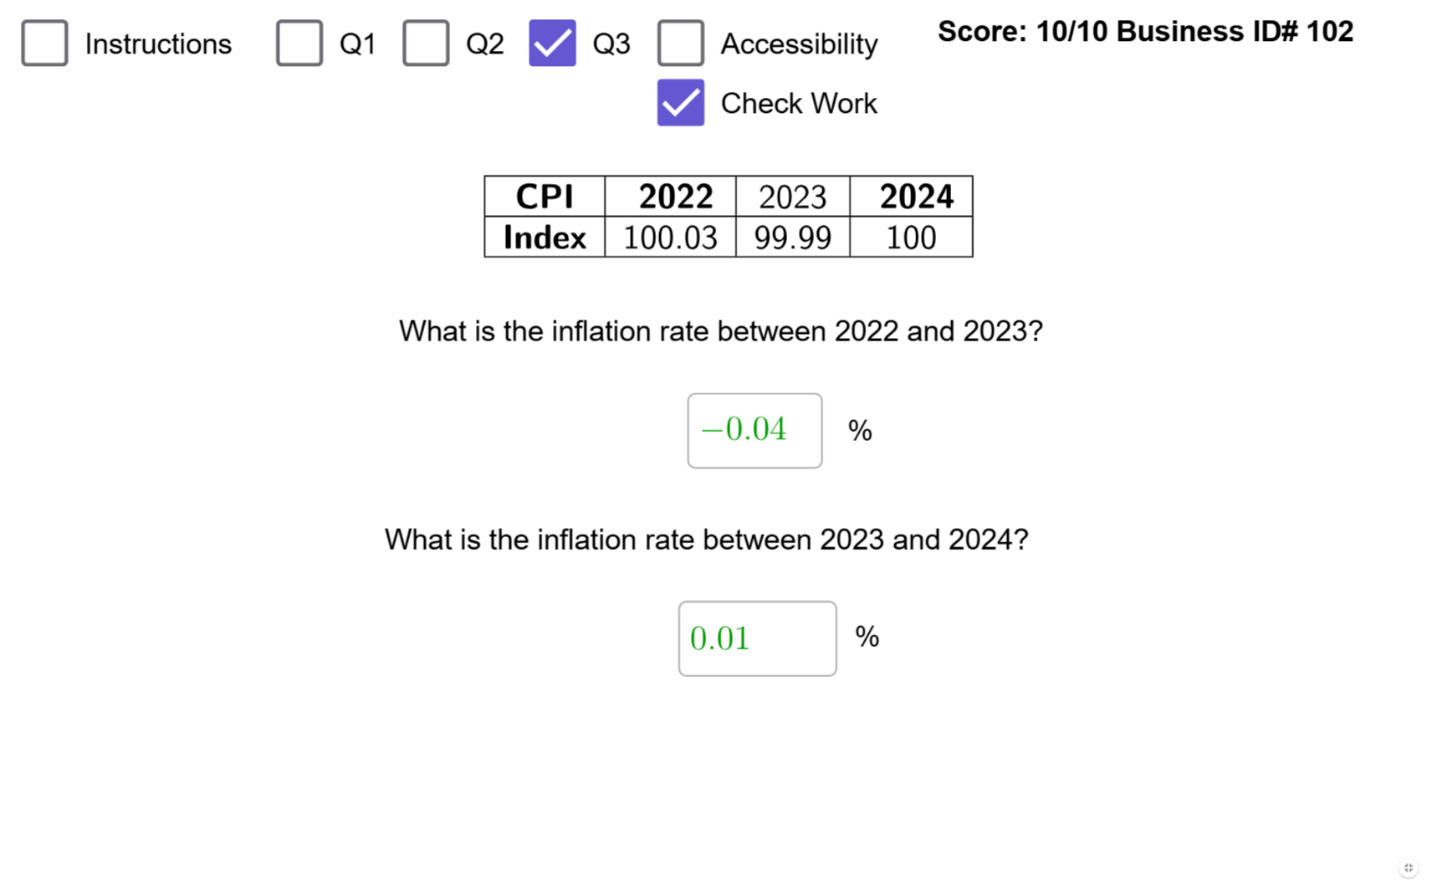
Illustrating a macroeconomic application, what follows is an activity related to calculating inflation using the Consumer Price Index (CPI). Within the example, students provide three goods produced within a simplified economy, for which they provide the associated prices of those products. What makes this application different from the other two is the student can provide an example of various prices, and these prices feed directly into the problem. Note that this example assumes equal quantity weights for simplicity, but a more realistic version with unequal quantity weights can be coded in GeoGebra. Questions Q1–Q3 can be found in the teaching note.
Using input boxes to enter prices allows students to practice information search and retrieval of pricing information compared to having prices given to them. The instructor can use this type of setup if they want students to first explore current pricing before calculating the inflation rate. This can be modified so that students look up pricing information for 3 years of the same products and then calculate the inflation rate for those three products.
The goal of this exercise is to reinforce and apply knowledge of the CPI, including using market baskets to calculate the index and inflation rates for a particular basket of goods. It helps students build and understand indices and see how base years influence the calculation of CPI and the inflation rate. A part of the activity not shown asks students a follow-up question about whether these inflation rates are realistic, prompting students to consider what inflation rates are likely to be observed in reality.
.png)
This case also reinforces GeoGebra’s iterative capabilities where students’ answers from previous parts (Q1 and Q2) of the activity populate future questions. Meaning the cost of each basket carries over from Q1, the CPI values calculated based on the base year are carried over to Q3 as shown in the table in Figure 5. Another interesting element in this question is the use of a base year. Students are assigned different base years to ensure that they get their own unique problem set. This also provides students with practice applying different base years compared to examples given in class. Students can then apply their knowledge of calculating inflation rates to their problem.
Students are adept at solving the type of problem that involves applying formulas directly. The questions follow a clearer logic for most of them, and they are not as confusing compared to the graphs. Also, by this time in the course, students have calculated the cost of various items, so finding the cost of the basket is an application of skills students have learned earlier in the course. The rate of change equation by this time in the course has also been used a fair amount, making it more challenging to follow the steps and adapting and applying previous concepts to inflation rates.
Across the three applications, the learning outcome targeted was “displaying a command of existing economic knowledge,” particularly concepts such as supply and demand, perfect competition, and inflation. Overall, these activities get students to interact with these topics directly. Most students successfully work through these activities, though some do not complete the work. Those not completing the activities may lack understanding or not be attempting the problem. Failure to complete them might stem from the lack of online resources specific to economics in GeoGebra.
There is an initial learning curve for students interacting with the tool, and the author provides several demonstrations/tutorials for students at the beginning of the course. After learning to navigate GeoGebra, most students work through the activities successfully. They sometimes get hung up on the graphs or what the instructions are asking, but that is not uncommon, even without GeoGebra. However, students who need it tend to ask for help and can navigate the questions. Because GeoGebra has not been widely used in economics, there are few online resources for help with the activities themselves. While some might see this as a disadvantage for those struggling who might need more tutoring or professor/TA support, this can also be an advantage as the student must take the initiative to ask for help or spend more time thinking through the answer before relying on online resources. Another advantage is that AI is not quite as effective at finding solutions/answer keys, though GeoGebra is not immune to AI.
An observation from classroom use is that students struggle more with what the questions are asking than with the GeoGebra interface itself. After the first few workbook tasks, most can navigate the program. Students tend to struggle with graphs in general, regardless of which program is used. The author has noticed in class that most students, when taking notes, do not draw the graphs and only follow along. Once students get to the application, they have not practiced graphing and do not know how to approach them. What the author found helpful about GeoGebra was that students could not avoid graphing the problems themselves. Through GeoGebra, they learn more about not only interpreting graphs but also how to construct and manipulate them.
3.4. Extending GeoGebra to Other Classroom Applications
Given GeoGebra’s flexibility, there are countless application possibilities beyond the introductory economics course. For example, one could create an activity that uses a dynamic version of IS-LM and AS-AD to look at policy changes and their impact on the macroeconomy within a course like intermediate macroeconomics. For intermediate microeconomics, students could build their own indifference curves and isoquants and examine the implications of different shapes of indifference curves. GeoGebra can also handle 3D graphing to help students better conceptualize an indifference map. For courses that graph externalities, tariffs, and efficiency loss, GeoGebra can be used to visualize changes in efficiency. While these examples are graphical, it could also be linked with algebra and other equations to help students recognize how the graphs relate to the equations and how graphs change when the initial equations are modified.
In econometrics, GeoGebra can also be used to look at probability distributions, basic regression analysis, other areas of statistics, and calculus. The probability and statistics features would be especially helpful for visualizing distributions and understanding some of the more challenging theoretical concepts in econometrics in a more hands-on way. For example, the 3D graphics feature would allow one to better illustrate concepts like heteroskedasticity. While econometrics courses primarily utilize programs such as Stata, RStudio, and Python, GeoGebra can be used to demonstrate what different s look like on a graph or to illustrate changes in probability distributions and other concepts that might be harder to visualize in a traditional coding environment. Additionally, within GeoGebra, it is easier to see students’ work in real time and show the whole class a concept compared to coding programs like RStudio. Without the coding interface cluttering the screen, students can interact with a concept more directly.
4. Discussion
When considering any new tool, it is important to analyze whether investing in it is worth it. Instructors have limited time to prepare, and one’s stage in their career helps determine whether incurring the upfront cost of the investment is justified.
GeoGebra caters well to different levels of time investment. If one is short on time or motivation but wants an interactive activity to use with students, activities shared within the GeoGebra community are readily available. The benefit of using GeoGebra in this way is that the activity has already been created and is ready to apply. Utilizing a GeoGebra activity for an in-class exercise using GeoGebra Classroom is a great way to start.
Another level of investment involves creating one’s own GeoGebra activities. The upfront cost of learning the tool can be substantial, especially if the goal is to create more complicated activities like those shown above. Again, there are levels of investment in creating activities as well. While the examples shown were relatively complex, they do not have to be. These examples demonstrate some of the capabilities of the tool and the types and levels of activities one can create. Instructors who have time to develop activities and feel that the students are not grasping the concepts, especially in class, could benefit from GeoGebra. Additionally, professors trying to pivot toward a flipped classroom might use GeoGebra activities as a starting point, helping the transition from lecture-heavy courses to a more applied learning environment.
The nice thing about these activities is that one can embed them into different assignments, cases, and assessments. For example, the author implemented an in-class activity that requires students demonstrate supply and demand shifts based on what is happening in an AI prompt. The GeoGebra activity requires students to graph what is happening, then discuss their graph in groups within the classroom to see how it matches what the prompt suggests. In that example, the prompt was randomly generated by ChatGPT based on demand and supply determinants.
In terms of adaptability across levels, besides the upfront fixed cost of creating activities, it can be adapted to potentially any economics course that has a graphing or math component. In courses like econometrics, it might be treated as more of a supplement, and in courses with more graphs, such as intermediate micro or macro, it might be used more heavily. It depends on the type of math that instructors want to cover, but GeoGebra can handle some statistics, algebra, calculus, and more. After implementing the software in both in-person and online settings, it works just as well in both. There is a greater learning curve for online students, where the author typically provides a tutorial video for the first activity within the workbook to help students understand how GeoGebra works and how to approach activities.
The convenient part about GeoGebra is that it lends itself well to online learning because instructors can easily see students’ work in GeoGebra Classroom. For example, while helping a student over Zoom, students can share their screen or the instructor can share theirs while interacting with the work the student has done so far. However, when the professor helps with the student’s work on the instructor’s screen, it does not change the work on the student’s side. This allows the instructor to illustrate what to do without directly giving students the answer.
In terms of scalability, there are limitations. The more complex the activity in terms of the code, the harder it is for GeoGebra to run properly. The more details one tries to fit into a single GeoGebra applet, like the ones shown above, the slower the program will run. For example, in the perfect competition example, there are four questions, Q1–Q4, with multiple dynamic graphs as well as some background scripting. The greater the complexity of the problem implemented, the more challenging it is for GeoGebra to run, especially on slower computers.
Additionally, if an instructor sets up a problem where each individual gets their own unique problem, a class with more sections and more students per section will increase the complexity of the code. However, if problems are randomized instead, it should be less taxing on the program, even with many users of an activity. For larger classes, these activities might work well for the smaller TA sessions if using GeoGebra for an in-class exercise. That said, using Google Classroom in a large lecture, students could complete an activity in class, and the instructor could pull up a few student examples up on the screen.
In most cases, larger universities will have teaching assistants (TAs), especially for the introductory courses, while smaller universities and colleges tend not to. Smaller universities tend to have professors who are more teaching-focused than research-focused, so they might have more time to spend adapting new tools compared to larger more research-focused universities. However, for those courses that do not have TAs who could help implement GeoGebra, instructors could build up activities over time. Maybe there is a particular topic that the instructor has struggled to teach in the past and it is hard for students to visualize, so the instructor might create a GeoGebra activity about it. Then they can see how the implementation goes and over time can create more activities and assignments until they either have enough to make homework assignments out of them, potentially flip the classroom, or provide supplemental interactive material. The author has also tried to build a few activities with AI with mixed results, but this might make creating GeoGebra activities more accessible with a lower time cost.
In terms of replicability, if an activity with a public link has already been created, instructors can copy that link and create a new activity with relative ease. Replicating the code from the earlier activities from scratch would take a significant amount of time to build the infrastructure to run all the check boxes, input boxes, graphs, etc. However, the teaching note walks instructors through how to go about creating an activity and there are online tutorials for GeoGebra that are helpful. Once instructors understand the platform creating new activities can go much more quickly once they know what type of activity they want to make.
Something not shown in the examples but that may be of interest to instructors is the ability of students to use some of the tools found in the tool bar. For example, one can limit the tools to say the segment and point tools, and students can use them to draw demand curves. More advanced assignments could require students to create their own GeoGebra activity.
It is difficult to say definitively whether this approach improved conceptual understanding. The program was implemented in the author’s Principles of Economics course after their first year of teaching at the institution; since the author was the only economics instructor, there was no other direct group for comparison. However, scores on the Peregrine exam that senior business students take related to economics have increased compared to previous years, and relative to the region, since the author began teaching there. Whether that is indicative of teaching quality, assessment tools like GeoGebra, or class effects is not possible to test based on the data available.
With any tool, instructors need to be mindful of student accessibility. Due to the customizability of GeoGebra, there are many ways activities can be made more accessible. Each of the figures above has a check box labeled “Accessibility,” which changes the color of objects and provides check marks for correct answers to help those who are color blind. Several of the author’s colorblind students have used it and have offered feedback on improvements like adding checkmarks. Screen readers also work with GeoGebra by describing any of the objects within the applet for those who are visually impaired. Those are just some of the ways GeoGebra can be made more accessible. Although there are financial constraints to using the software in terms of needing access to a computer or having internet access when using GeoGebra Classroom, there is no additional financial cost for students. This can be beneficial for students who are unable to pay for additional homework software, making educational access more equitable (Manganyana et al. 2020; Mthethwa et al. 2020; Zhang et al. 2025).
Since GeoGebra requires student interaction, it can potentially be used to promote active learning in the classroom. A GeoGebra activity might also be a nice way for instructors who have traditionally lecture-heavy courses or are new to teaching to switch up their instruction and make their classroom more interactive. A helpful feature of GeoGebra Classroom is that instructors can see student work in close to real time. For example, one can assign an activity in class, and if one group is doing well, the instructor can show their work to the class. Alternatively, if one group is struggling, the instructor can show their screen and talk through where they are stuck. By being able to help in real time it promotes greater engagement and collaboration. The author implemented this within a group in-class activity, and students could see their work on the screen. It promoted student accountability as they were expected to demonstrate their progress.
Additionally, economics courses come with their own set of challenges. Students often have varied levels of mathematical preparation, which makes understanding graphs challenging. GeoGebra gives students more practice relating a table or equation to a graph. Some students struggle with graphs because of how abstract they can be, or they understand them in the moment but fail to put them into practice. With a tool like GeoGebra, graphs can be interacted with and understood in a more hands-on way. If students can see how changing conditions change the graph, they can potentially relate to it more than when it is static. This hands-on method allows kinesthetic or visual learners another way to understand the material. It might also be used to make the classroom more inclusive, where instructors could assign a GeoGebra activity based on the students’ level or learning style. In this way, students in the same class could meet their educational needs based on their unique skill level.
Within a university, GeoGebra activities could be implemented across different instructors across the same course but different sections. There are options to add co-teachers or TAs within GeoGebra lessons or faculty can copy an activity and create a new lesson per section or per instructor, adapting it to their needs. In some ways the software could allow for standard assessments across a university’s introductory economics courses regardless of what textbook or materials a given instructor uses.
While fewer activities are available for economics on GeoGebra’s platform compared to what is available for mathematics, the more economics applets instructors create on the platform and share with others, the greater the network effects generated. Because the resources on the platform are open source, the financial barriers to using the software are minimal. The main financial barrier for students is whether they have access to computers or mobile devices that can handle running GeoGebra. On older computers, GeoGebra can be quite slow, and on mobile devices the window can be too small to reasonably complete the activities.
However, it can be used offline via iOS, Android, Windows, and Chromebooks (Zhang et al. 2025) and some students have completed the work that way, although desktop and laptop computers are preferred. The ability to work offline is a great feature for locations with limited internet access, improving equity in learning opportunities potentially between rural and urban locations or internationally.
As an instructor, it is important to know how well the tool will integrate with various learning management systems (LMS)[5]. GeoGebra integrates the best with Google Classroom but can be utilized in Canvas and various other LMS as well. The activities demonstrated previously belong to a Canvas workbook that students complete as a form of homework assignment. A link can also be provided within an assignment regardless of LMS and work can be saved within GeoGebra Classroom. Then the instructor can input the grade tabulated in GeoGebra into the relevant LMS.
5. Concluding Remarks
This paper provides a comprehensive look at the mathematics software GeoGebra and some of its potential uses in economics education. The affordability and versatility of the tool make it an exciting option for creating economics educational content and resources. The possibilities of what can be developed are vast and the open-source nature allows for the sharing of activities, with the more created and shared, the greater the value to instructors and students. The potential for interactive applications of this tool is immense. For economics instructors looking to increase student engagement and enhance learning across different levels of the curriculum, GeoGebra can be a powerful addition to their toolkit.
About the Authors
Kara Grant (grantk@georgefox.edu) is an assistant professor of economics with the College of Business at George Fox University.
Acknowledgments
The author has no conflicts of interest to declare regarding this manuscript.
AI Disclosure
ChatGPT 5.2 assisted the development of Table A1, which compares educational software options used within introductory economics courses. The AI helped identify missing software options not previously identified by the author that were relevant to the manuscript. Additionally, it provided a table format with consistent categories for software comparison. Any comparisons that AI summarized within the table were thoroughly reviewed, revised, and confirmed by the author, who vetted them based on their relevant websites. The only portion of the findings it could potentially influence would be the comparisons of the various software based on how the information is presented.
Human Subjects Disclosure
Nothing to report.