1. Introduction
Peter Siehl walked into the meeting being held in a technology room in his office building. It was Monday at 11:00 am. Several participants were already on the large screen, and he sat in a chair at the end of the rectangular table where he could see the screen and the meeting organizer, Jay Blank, who was also his supervisor. Peter was a financial analyst who worked for a merger and acquisition firm that managed investment and equity valuations, auditing, and accounting while partnering with a private capital lender for financing. This was the first big project that Peter had been assigned since he had completed his MS in agricultural and applied economics with a graduate minor in finance from the College of Business at a well-known university in the US Great Plains.
His firm had a client with an investment opportunity in a portfolio of alternative energy production sources and wanted to learn more about how to value traditional oil and gas industry firms. Peter had been asked to deliver on the following:
-
A detailed report on the existing competition in the oil and gas industry. This would encompass the company’s strategic positioning, diversification and green energy investment and financing strategy.
-
A computation of the 10-year industry cost-of-capital trend.
-
Evaluation of the risk in the oil and gas industry that has been consistently reported over the past 10 years.
-
Recommendation for client investment based on the findings about the competition, cost of capital, and risk in the market.
Peter had met with his supervisor last week to learn more about this task and the deadlines. This meeting was to introduce Peter to individuals within the firm that could help review his part of the project. Peter’s role in this meeting was to walk through his proposed approach for the research to help inform the firm’s clients about potential investments as informed by cost of capital and risk in the industry. His draft report was due the following Tuesday, giving him 6 days.
Jay started the meeting by saying, “Let’s go around and introduce each other so Peter knows each of you.” Others in the meeting included the company expert on equity valuation and an internal risk analyst. After the introductions, Jay turned to Peter and said, “Ok, Peter. The floor is yours.”
2. The Purpose
In preparation for the meeting, Peter had familiarized himself with the industrial organization of the oil exploration industry. The objective of the meeting was for Peter to walk through his approach and information resources and explain the expected deliverables, timeline, and resources he would need. Peter wanted to discuss the information he had collected and then bring in each person to the meeting to react to his approach and what resources he needed and how they could help.
Peter started by saying, “In order to help our client consider alternative investments, I am going to need to understand the cost of capital for existing competitors and learn about their investments in this industry.” The equity analyst interjected, “You mean, the WACC or weighted average cost of capital?” Peter nodded, “Yes.” He was planning to calculate it over time, noting that WACC differed across three periods: before Covid (2015–2019), Covid (2020–2022), and 2023–2024. It was important to note that the WACC was backward looking in the sense that it used historical data. Consequently, the WACC represented “average industry risk” at that point in time and was not considered a hurdle rate for internal investments since each firm had their own risk premium due to liquidity, duration, or other aspects of the investment. But it did include information available to a firm’s investment that was reflected in the capital structure of the firm. Thus, WACC was a useful measure to better understand how firms considered risk in those investments since the actual hurdle rate used for the investment was not public information.
Jay told the group, “Peter made a good point that the Covid years were likely going to be considered in the same way that economic data for 1943 to 1945 were often dropped in historical analyses due to the war economies across the world and although it was too soon, isolating those years might be useful.” Everyone nodded.
Peter began with a quick review of the firms in the industry, starting with one slide per competitor. He had prepared a firm overview using current revenue position and market cap value ending 2024. All companies included were well diversified, operating in both upstream and downstream segments of the industry. This had been sent as background material to be read prior to the meeting and would be included in the final report for their client.
After that report, Peter wanted to ask for feedback on whether his information was correct for each firm. Then he would go through his methodology for calculating the WACC. After that, Peter wanted to talk about how he would approach the level of risks in this industry and his timeline. Jay was a stickler on time and Peter wanted to be done in 1 hour, including receiving feedback from his colleagues.
3. Overview of Competitors
The information on each firm included existing geographical footprints, some measures of its size, ownership structure, lines of business, and description of its financial strategy (Table 1).
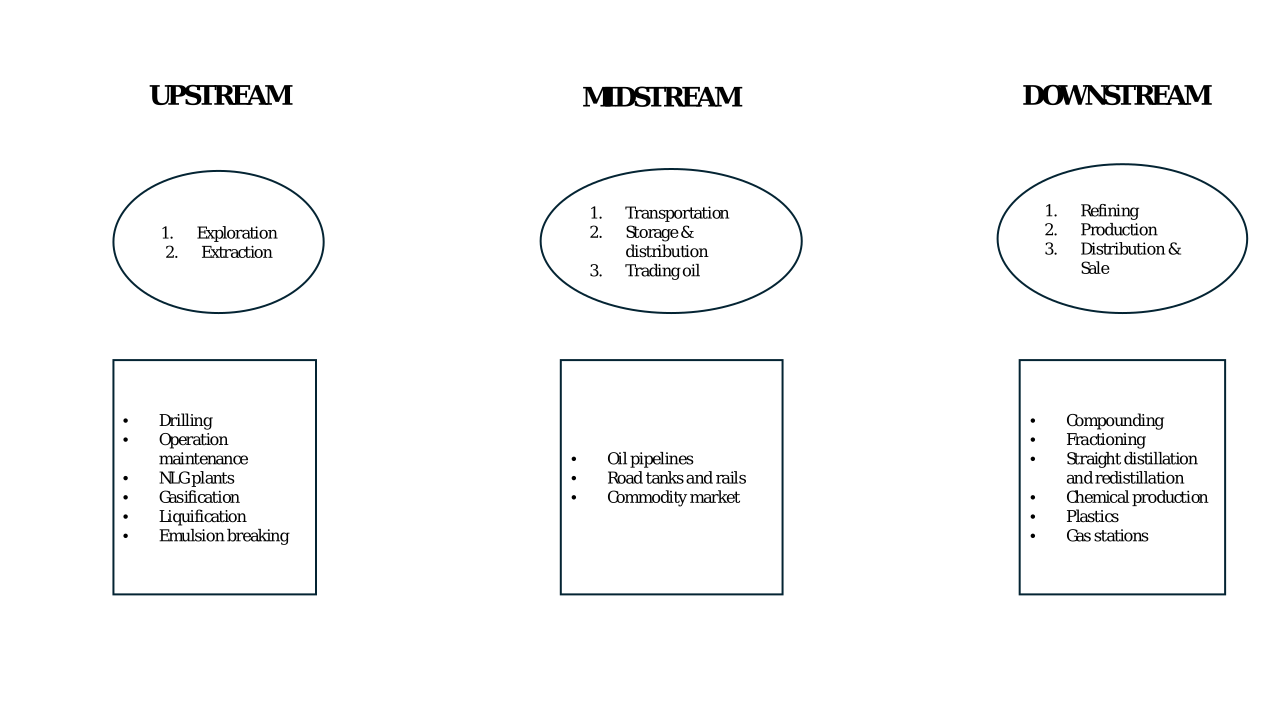
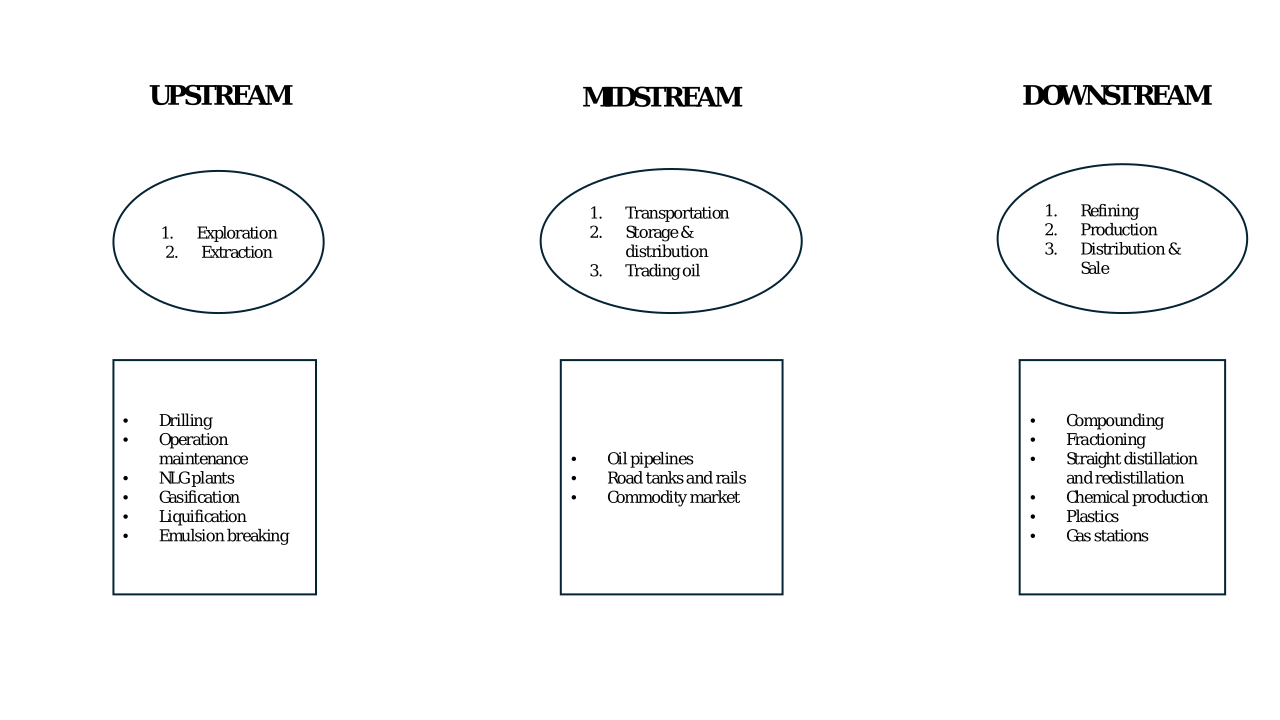
Peter had limited the discussion of the competition to the top eight firms based on value of assets and market capitalization. All other information would be in an appendix that summarized each firm. Peter pulled up a supply chain diagram of the petroleum oil industry. This was a common diagram used in supply chain classes and an effective way to show how firms chose their borders as part of the Make or Buy decision. Peter walked through the supply chain at a high level for the group. He notified the group that the industry was grouped into three stages: upstream, midstream, and downstream (Figure 1). These overlapped depending on the company operations and strategic position. Upstream and downstream had the most overlap, with midstream having the fewest due to firms outsourcing of these activities.
3.1. Saudi Aramco
Saudi Arabian Oil Company (Saudi Aramco) was a vertically integrated energy and chemicals company headquartered in Dhahran, Saudi Arabia. The company was diversified in upstream and downstream stages, including exploration and extraction, natural-gas processing, refining and petrochemicals, marketing and trading, and technology and innovation programs. Since the mid-2010s, Saudi Aramco had strategically expanded its downstream and chemicals portfolio broadening its cash flow base beyond upstream operations. These acquisitions represented a pivotal step toward deeper chemicals integration and strengthened Saudi Aramco’s capacity to convert hydrocarbons into higher-value products, supporting its international footprint.
Saudi Aramco’s strategy was built around the assumption that affordable energy solutions and low-cost carbon fuels would complement conventional fossil fuel sources. Saudi Aramco had invested significantly to capture 9 million tons of CO₂ annually, with two-thirds coming from its operations. These investments reflected a deliberate strategic tilt toward lower-carbon activities.
Saudi Aramco funded most of its capital program from operating cash flow and retained strong sovereign backing, supplementing internal resources with debt issuance and selling equity shares from 2019 to date. The recent investment pattern showed a firm reallocating capital away from marginal, high-carbon expansions toward lower-carbon, higher-value opportunities as a pragmatic response to potential asset obsolescence pressures and to the evolving policy and market environment (Saudi Aramco 2024). Peter finished by noting that his discussion on Saudi Aramco was a little longer, but they were three times the size of the next competitor and had a broad global footprint. Jay said, “ExxonMobil is next, correct?” Peter nodded in agreement and proceeded.
3.2. ExxonMobil
ExxonMobil Corporation was an integrated energy and chemicals company organized into upstream and downstream segments. The company produced Energy Products, Chemical Products, and Specialty Products. In 2024, ExxonMobil reported investments in the Low Carbon Solutions business to advance carbon capture and storage (CCS), lithium, and “virtually carbon-free” hydrogen projects with approximately 98% of CO₂ captured and stored. ExxonMobil recognized that low carbon production required enough energy production to create a better alternative in oil extraction. Its financing approach relied on a conservative leverage profile, access to capital markets across business cycles, and internally driven allocation to projects with attractive returns and competitiveness at the low end of the cost curve (ExxonMobil 2024). Peter wrapped up by noting that they had a broad portfolio.
3.3. Chevron Corporation
Chevron Corporation was established in 1879 in California as the Pacific Coast Oil Company, which later became part of Standard Oil. Chevron expanded through multiple mergers and acquisitions, including the purchase of Gulf Oil in 1984, Texaco in 2001, and Noble Energy in 2020. It was one of the world’s largest integrated energy companies, operating in over 100 countries; its business strategy emphasized delivering affordable, dependable, and ever-cleaner energy through operational excellence, capital discipline, and innovation. Chevron’s major initiatives included reducing methane emissions through facility retrofits and expanding the Geismar renewable diesel facility in Louisiana to 340 million gallons per year. Chevron had new ventures such as the Bayou Bend CCS project in the US Gulf Coast and hydrogen production initiatives in Australia and the United States. These efforts aligned with Chevron’s goal of achieving a 25% reduction in upstream carbon intensity by 2028 relative to 2016 levels. Capital expenditures totaled approximately $16.6 billion in 2024, of which more than $3 billion supported lower-carbon and renewable projects. Chevron’s financing strategy focused on maintaining dividend stability and funding growth through a combination of operational cash flow. “Now onto Shell,” Jay said.
3.4. Shell Plc
Shell traced its origins to 1890, when the Royal Dutch Petroleum Company was founded to compete with Standard Oil, later merging in 1907 with the Shell Transport and Trading Company of the United Kingdom, which was established by Marcus Samuel as a trading and transport firm. Shell was a highly diversified oil and gas company operating in more than 70 countries with a global network of approximately 46,000 service stations running over 20 refineries. The company operated the deepest oil and gas project in the Gulf of Mexico and the largest offshore liquid natural gas (LNG) production plant off the Australian coast.
Shell’s business strategy was built around three key pillars: upstream, transition, and growth (Shell, Plc 2024). The upstream pillar focused on oil and gas exploration and production, generating strong cash flows to fund shareholder distributions and future low-carbon investments. The transition pillar centered on integrated gas, chemicals, and products to provide sustainable cash flow from liquefied natural gas, petrochemicals, and refining activities while simultaneously reducing the carbon intensity of its operations. The growth pillar directed investments toward low-carbon and renewable energy ventures, including hydrogen, electric vehicle charging, biofuels, and integrated power generation.
In recent years, Shell expanded its renewable and low-carbon portfolio through investments in hydrogen production hubs in Europe and the acquisition of electric charging networks. However, in 2025 the company cancelled the construction of its Rotterdam biofuels plant following a cost reassessment, a move that reflected its more selective approach to transition-related investments as Shell forecasted low projections in the investment reevaluation. Shell’s financing strategy emphasized capital discipline, shareholder returns, and debt reduction and financed investments from cashflows and targeted bond issuance. Peter finished by saying, “Shell has really made some big changes in the last 12 months, similar to our next firm.” Jay said, “And now we have our French ally to discuss Total Energies.”
3.5. Total Energies
Total Energies was a French multinational integrated energy and chemicals company horizontally integrated into oil, gas, renewables, and electricity. Its shares were widely held by institutional and retail investors, with the French government retaining a minority stake. The company operated across five key segments: exploration and production, integrated liquid natural gas (LNG), integrated power, refining and chemicals, and marketing and services, increasingly emphasizing low-carbon energy and electricity generation. The company invested in low-carbon projects including renewables, hydrogen, biofuels, and carbon capture initiatives. These investments comprised a deliberate strategy toward integrated power and gas through acquisitions of gas-fired power plants and power storage and aggregation. Total Energies expanded its LNG footprint through new capacity in Malaysia and Texas (Total Energies 2024).
In addition, Total Energies sold its stake in an offshore wind project, exited a solar and wind portfolio and service-station networks, and divested its Canadian oil sands operations. These strategic initiatives reallocated capital out of mature, high-emission or low-margin assets into industries with stronger growth and strategic alignment, such as LNG, renewables, and integrated power. Its portfolio in sustainable aviation fuel expanded through long-term supply partnerships with Airbus, Air France-KLM, and Sinopec. Total Energies invested in biomethane production and in carbon capture and storage (CCS) ventures alongside new low-carbon LNG developments. The company financed most of the investment using cashflows from operations and $46 billion cash reserves. Its financing strategy emphasized financial flexibility, low debt levels, and capital efficiency. “And now we leave the continent to discuss a US firm,” Jay said. He signaled to Peter to pick up the pace by twirling his fingers.
3.6. ConocoPhillips
ConocoPhillips was an independent exploration and production company focused on finding, developing, and delivering crude oil, natural gas, and natural gas liquids. Its portfolio was organized by geography rather than downstream integration, with a core footprint in the US and Canada. The firm included acquisitions that deepened shale and LNG optionality, divestitures of noncore or higher-cost assets, and continuous optimization of working interests, combined with an operating model that concentrated capital on short-cycle unconventional development while retaining exposure to advantaged conventional and LNG assets for durable returns.
ConocoPhillips’ financing strategy and performance reflected a disciplined balance between shareholder dividends, capital reinvestment, and structural expansion through targeted acquisitions (ConocoPhillips 2024). Since 2021, the company had completed a series of transformative transactions that had reshaped its production and cash-flow base: The acquisition of Concho Resources added significant Permian Basin exposure and its assets consolidated ConocoPhillips’ position as one of the basin’s largest operators, and it acquired Marathon Oil. These deals were financed primarily through a combination of share issuance and internal cash flow, preserving balance-sheet flexibility without materially increasing leverage.
Internal cash flow remained the principal funding source for capital expenditures and shareholder distributions, with debt used selectively to smooth timing mismatches or fund accretive transactions. Overall, ConocoPhillips’ financing approach demonstrated conservative leverage management and a shareholder-focused capital discipline supported organic growth and acquisitive expansion while maintaining resilience across commodity cycles. “And now we are onto Enron. I suppose you talked a lot about them in your graduate program, Peter? Lots of case study examples?” Jay laughed.
3.7. EOG Resources
EOG Resources, Inc., established as Enron Oil & Gas Company, was an independent exploration and production company in the United States. The company’s core business was the exploration, development, and production of crude oil, natural gas, and natural gas liquids, with a focus on shale and other unconventional resource plays. Its operations were concentrated in the US lower 48 states, including the Delaware Basin, Eagle Ford, Powder River Basin, and Williston Basin (EOG Resources 2024). EOG’s strategy centered on a self-sourced, high-return investment model emphasizing capital discipline and technical innovation. The company’s premium drilling strategy required every new well to achieve at least a 30% after-tax rate of return at $40 per barrel of oil, ensuring profitability even at low commodity prices. EOG advanced this framework with its “double-premium” target, 60% after-tax returns at $40 oil and $2.50 gas, driving consistent free-cash-flow generation. Over time, the firm had tripled its inventory of premium drilling opportunities, focusing on organic growth rather than large-scale acquisitions, which distinguished it from peers pursuing consolidation.
EOG’s conservative capital structure, internally funded capital program, and counter-cyclical investment approach allowed it to preserve an investment-grade credit rating and sustain growth without dilution or excessive leverage. By combining low debt, high returns, and consistent shareholder distributions, EOG had a resilient financing model that aligned with market discipline and long-term value creation, reinforcing investor confidence amid commodity volatility. Peter finished by saying, “They are a really disciplined firm. Much different than what the average person might think. Our last firm is Marathon, which was just acquired by ConocoPhillips, but it was important to treat it separately.”
3.8. Marathon Petroleum
Marathon Petroleum Company (MPC) operated both downstream and midstream in one of the largest integrated refining and coordination systems in the country. Through its Refining & Marketing (R&M) segment, MPC processed and distributed refined petroleum products through its midstream subsidiary MPLX LP. The company had broadened its business scope beyond traditional fossil-fuel refining by investing heavily in renewable fuels, especially through its Dickinson Renewable Diesel facility in North Dakota with an output capacity of about 184 million gallons per year. The company’s Renewable Fuels segment was a core business in its midstream refining segment.
The company performance in 2024 reflected challenging market conditions for refining: The full-year net income attributable to MPC was $3.4 billion. However, they managed to maintain liquidity and capital-return discipline to finance its capital expenditure. Marathon had recently divested in its gathering and processing operations to refocus on core Permian and Marcellus basins with higher returns. Their strategy had remained duo track with the development of renewable energy in the midstream sector, which enabled them to hedge their risk in investments.
3.9. Industry Summary
Peter summed up his report by saying, “The choice of investments for each of these companies were driven by a combination of regulatory risks, especially climate-related, shifting demand patterns, and rapidly changing technology economics. These external forces affected the hurdle rates for high-carbon, capital-intensive projects and increased the relative attractiveness of investments in LNG, CCS, renewables, and other advanced technologies. What is interesting is that each firm has a different financial strategy and portfolio of businesses with some being horizontally diversified into various industries and others vertically integrated. And their ownership structures have an impact on the duration of their investment decisions. This is valuable information for our client.”
4. Approach to Calculate the WACC
After a brief discussion on the competition, which involved his industry expert colleagues pointing out some useful issues, Peter said, “Let us switch to a discussion on how I will calculate the WACC for each firm. My plan is to create a tool in a spreadsheet that would migrate financial data from Bloomberg, FRED (Federal Reserve Economic data), and SEC (Securities and Exchange Commission) 10K fillings. My spreadsheet will never actually contain the data so we do not have to worry about data errors, but will use cell references to calculate the information needed to calculate the WACC by year and firm.”
Peter showed his WACC calculation as:
\[WACC = W_{d}K_{d}(1 - t) + W_{e}K_{e} \tag{1}\]
\[K_{e} = CAPM \tag{2}\]
\[CAPM = R_{f} + \ \beta\left( R_{m} - R_{f} \right) \tag{3}\]
\[\beta = \frac{\left( COV\left( R_{I} - R_{m} \right) \right)}{\left( VARR_{M} \right)} \tag{4}\]
where was the weight of debt in the capital structure, was the value of long term debt, was the annual effective tax premium, was the weight of equity in the capital structure where the sum of and was 1, was a risk-free rate of the 10-year treasury bond, was the market risk premium determined by annual average risk free rate and returns on the S&P 500, and was the market risk of the company. The COV represented covariance and VARR, variance. All the variables were reported in decimals, and the units were US dollars (USD).
Peter explained the formula for the WACC and the sources of data used for his assessment. His colleagues knew all of this, but it was a good refresher to make sure they were all on the same page. The equity analyst noted that all but one of the firms (Saudi Aramco) were publicly traded, so their databases should have the information Peter needed. Peter responded by saying, “Yes, but Saudi Aramco sold a small part of its equity in 2019 and so there is some information being announced regularly.”
5. Discussion About Risk
Peter looked up at the clock; 45 minutes had gone by. He needed to pick up the pace a little to be done in an hour, he mentally told himself. “In our next meeting, I will show you my WACC calculations. Then after that, my intention is to discuss risks in this industry and how they might apply to the alternative energy sources per our client’s portfolio investment opportunity. Now let me describe how I will prepare that analysis.” Peter discussed the data he would use from a variety of sources including risks revealed by each firm to their shareholders. He showed them a matrix of how he might present the information. There was no further discussion from his colleagues since they had little to contribute at this stage.
Jay looked at the clock and said, “Peter, in the remaining 7 minutes, tell us when we can expect to see what you have done and what happens next.” Peter explained that he wanted to meet again at the end of the week after he had completed a draft of his WACC calculations and then early next week with a draft of his risk discussion. Once his calculations had been reviewed and agreed upon, the same would be done for the risk assessments. That information would be turned over to an internal creative designer using Tableau who would take the data and information to prepare an initial report draft using Peter’s information after it was peer reviewed. “Sounds good, Peter, and right on time. Let us adjourn so we can eat lunch and get back to our desks.”
6. The Next Two Days: Tuesday and Wednesday
Peter began creating the software code to bring the data he needed into his spreadsheet for the WACC calculations. As a graduate student intern at the firm, he had learned the importance of designing tools that could be used and interpreted by someone who had not created the tool. His agribusiness professor would be happy, Peter thought to himself. The professor had insisted that students create the perfect spreadsheet that someone else could use for their capstone project. One of his internship responsibilities had included designing a spreadsheet tool. In this case, his tool would be created within a computer spreadsheet. Peter wanted to innclude the WACC calculation in a bar chart for each year for each firm. He wanted to show a stacked bar chart by year so he could better understand the data.
He was bringing in the risk information because some of the information was contained in the same files utilizing the 10-K files from reports made to the US Securities and Exchange Commission. Using content analysis, Peter grouped the 2024 risk factors into five broad categories: market and financial operations risk, operational risk, climate change risk, external risk, and geopolitical/regulatory risk.[1] He used frequency analysis to determine the prominence of each risk based on how often it appears as a key concern across reports of each of the companies. Peter developed a five-point scale to assess the potential impact of each risk on financial performance, operational stability, and strategic positioning, with 1 representing negligible impact and 5 representing high impact.
Universal risks such as commodity-price volatility, regulatory shifts, and climate-transition pressures had higher impact scores because of their sustained influence on profitability and investment behavior, while more controllable risks like insurance costs, operational risks or business ethics were scored lower. The aggregated scoring data were visualized in an annual risk map using a scattered bar chart that tracked the prominence and intensity of each risk category over time. The earlier periods, 2019–2023, were grouped using the same categories, but this time he used the intensity of reporting the risk as the main factor rather than a result of certain risk occurring. Peter grouped them on a binary scale and plotted a scatter bar chat showing the frequency of reporting. On Wednesday afternoon, Peter sent an email to his colleagues with an encrypted Google Drive spreadsheet and document so they could look before Thursday’s midday meeting.
Peter noted in his cover memo describing the spreadsheet calculations that he had integrated quantitative financial modeling with qualitative risk analysis to explore how key risk factors influence the WACC and corresponding hurdle rates of leading oil and gas companies. The research in the spreadsheet used data from the eight largest oil and gas companies by market capitalization. Their annual reports and 10-K filings for the period 2014–2024 provided the quantitative inputs for financial modeling and the qualitative disclosures for risk analysis. These data were obtained from Bloomberg, the Federal Reserve Bank of St Louis Database, FRED (2014–2024), and SEC (2014–2024) company annual 10-K filings. Peter remembered how nice it was to find time to use the Bloomberg terminals for a class project in his graduate course in agricultural price analysis since the terminals were in the commodity trading classroom with this information. Now he had a terminal on his desk! It had been an attractive recruiting feature as he had looked at graduate agribusiness degree programs because a close relationship with the College of Business was something he valued. By combining numerical estimation with textual content evaluation, this methodology captured the interplay between financial structure, market performance, and the evolving regulatory and environmental landscape that shapes capital cost dynamics in the energy sector.
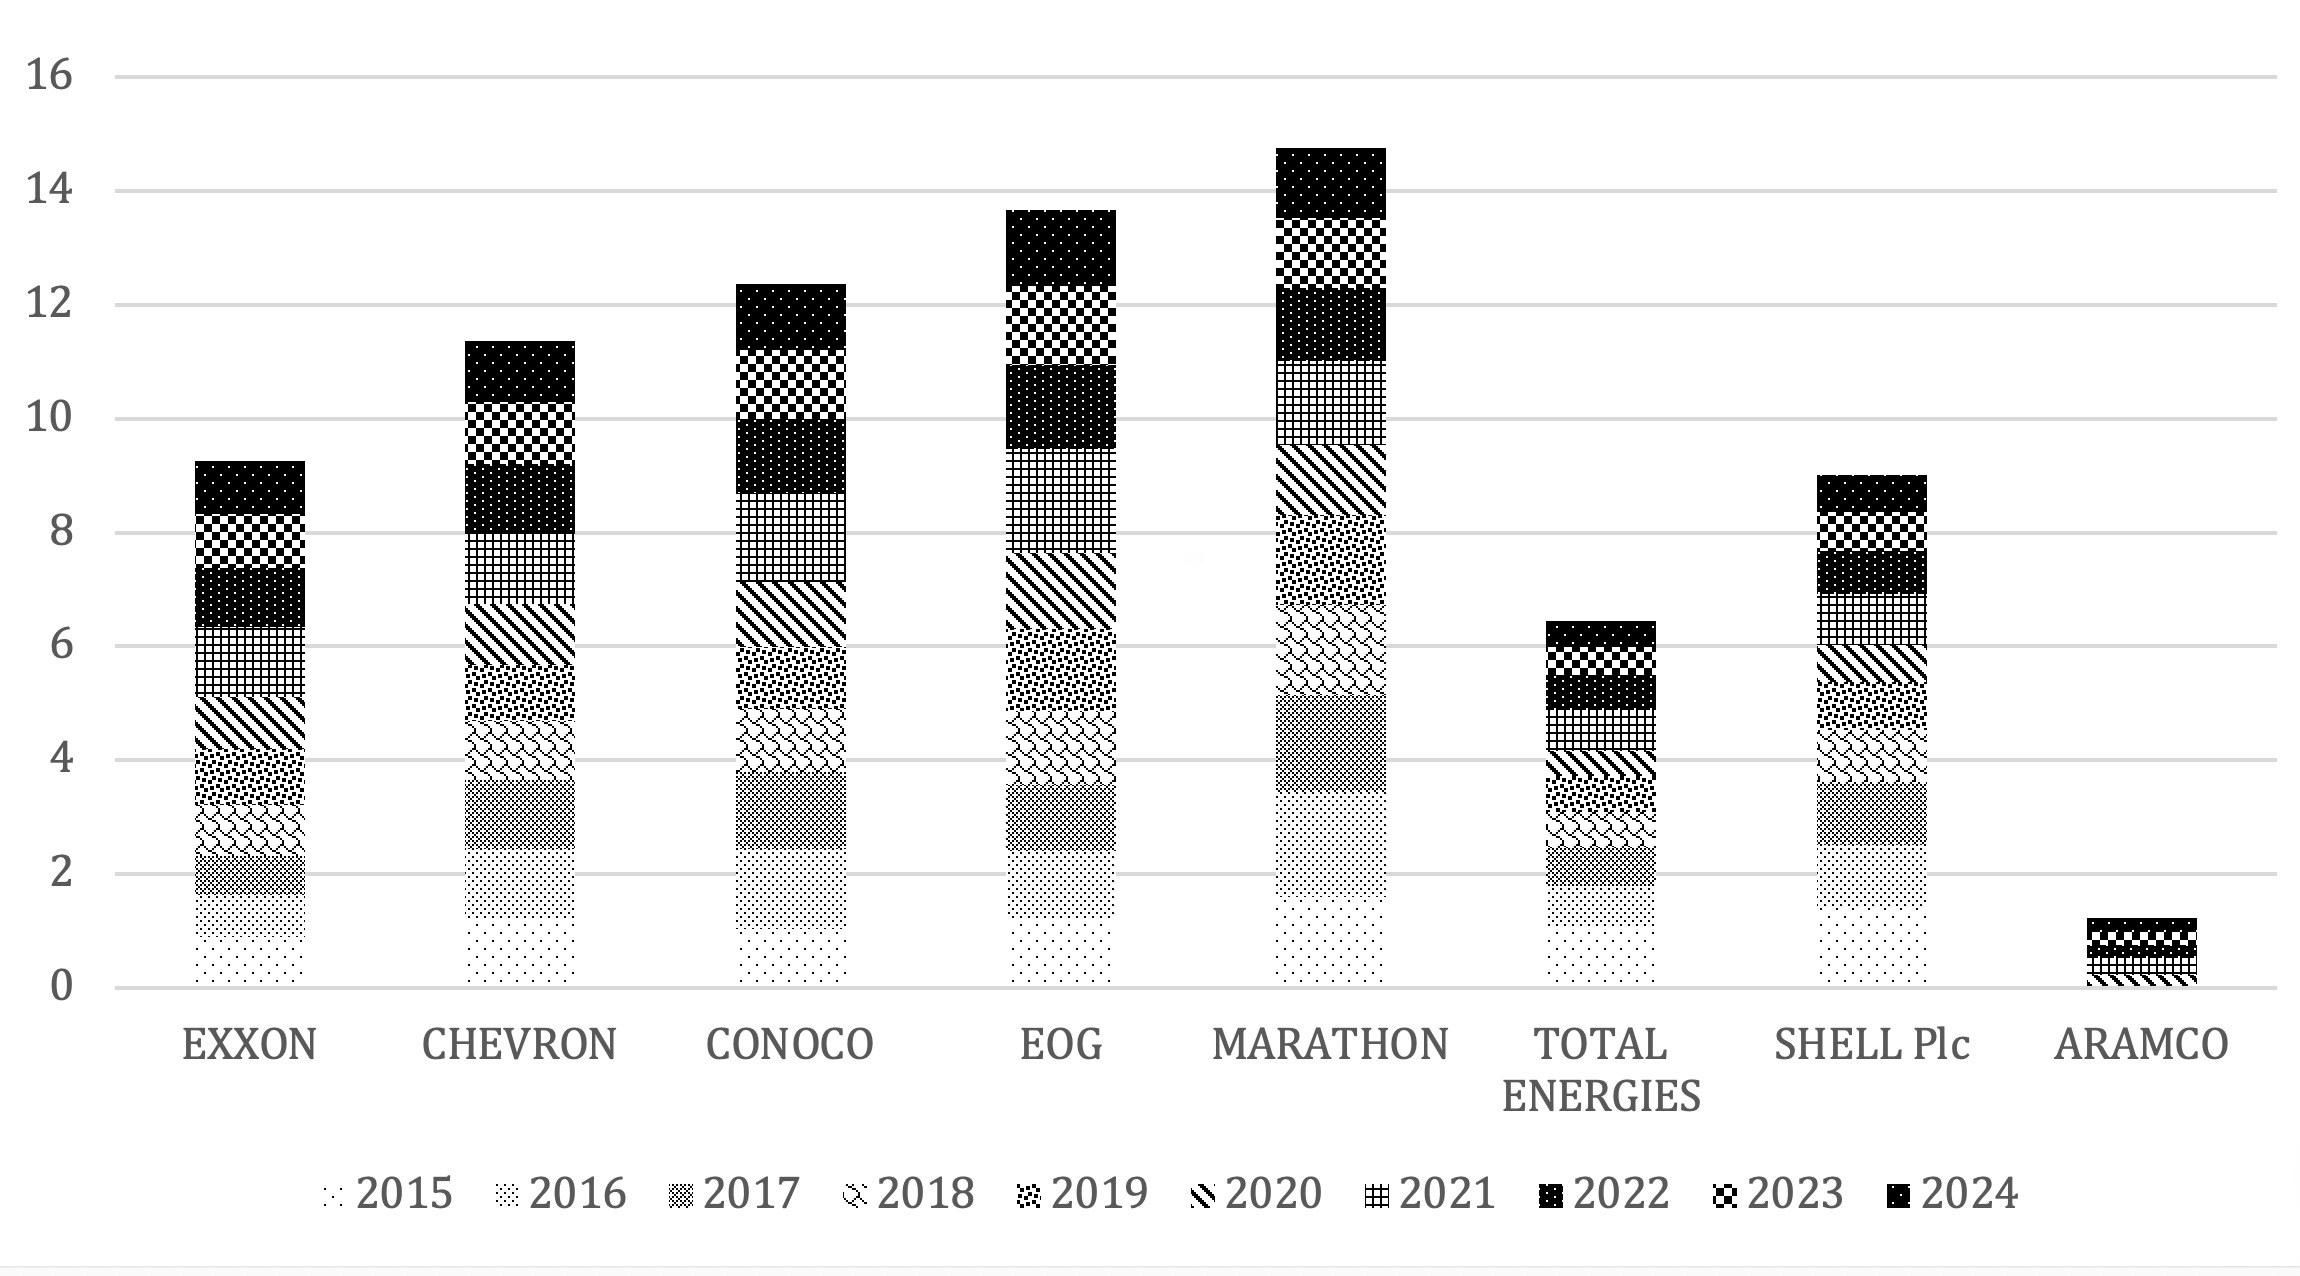
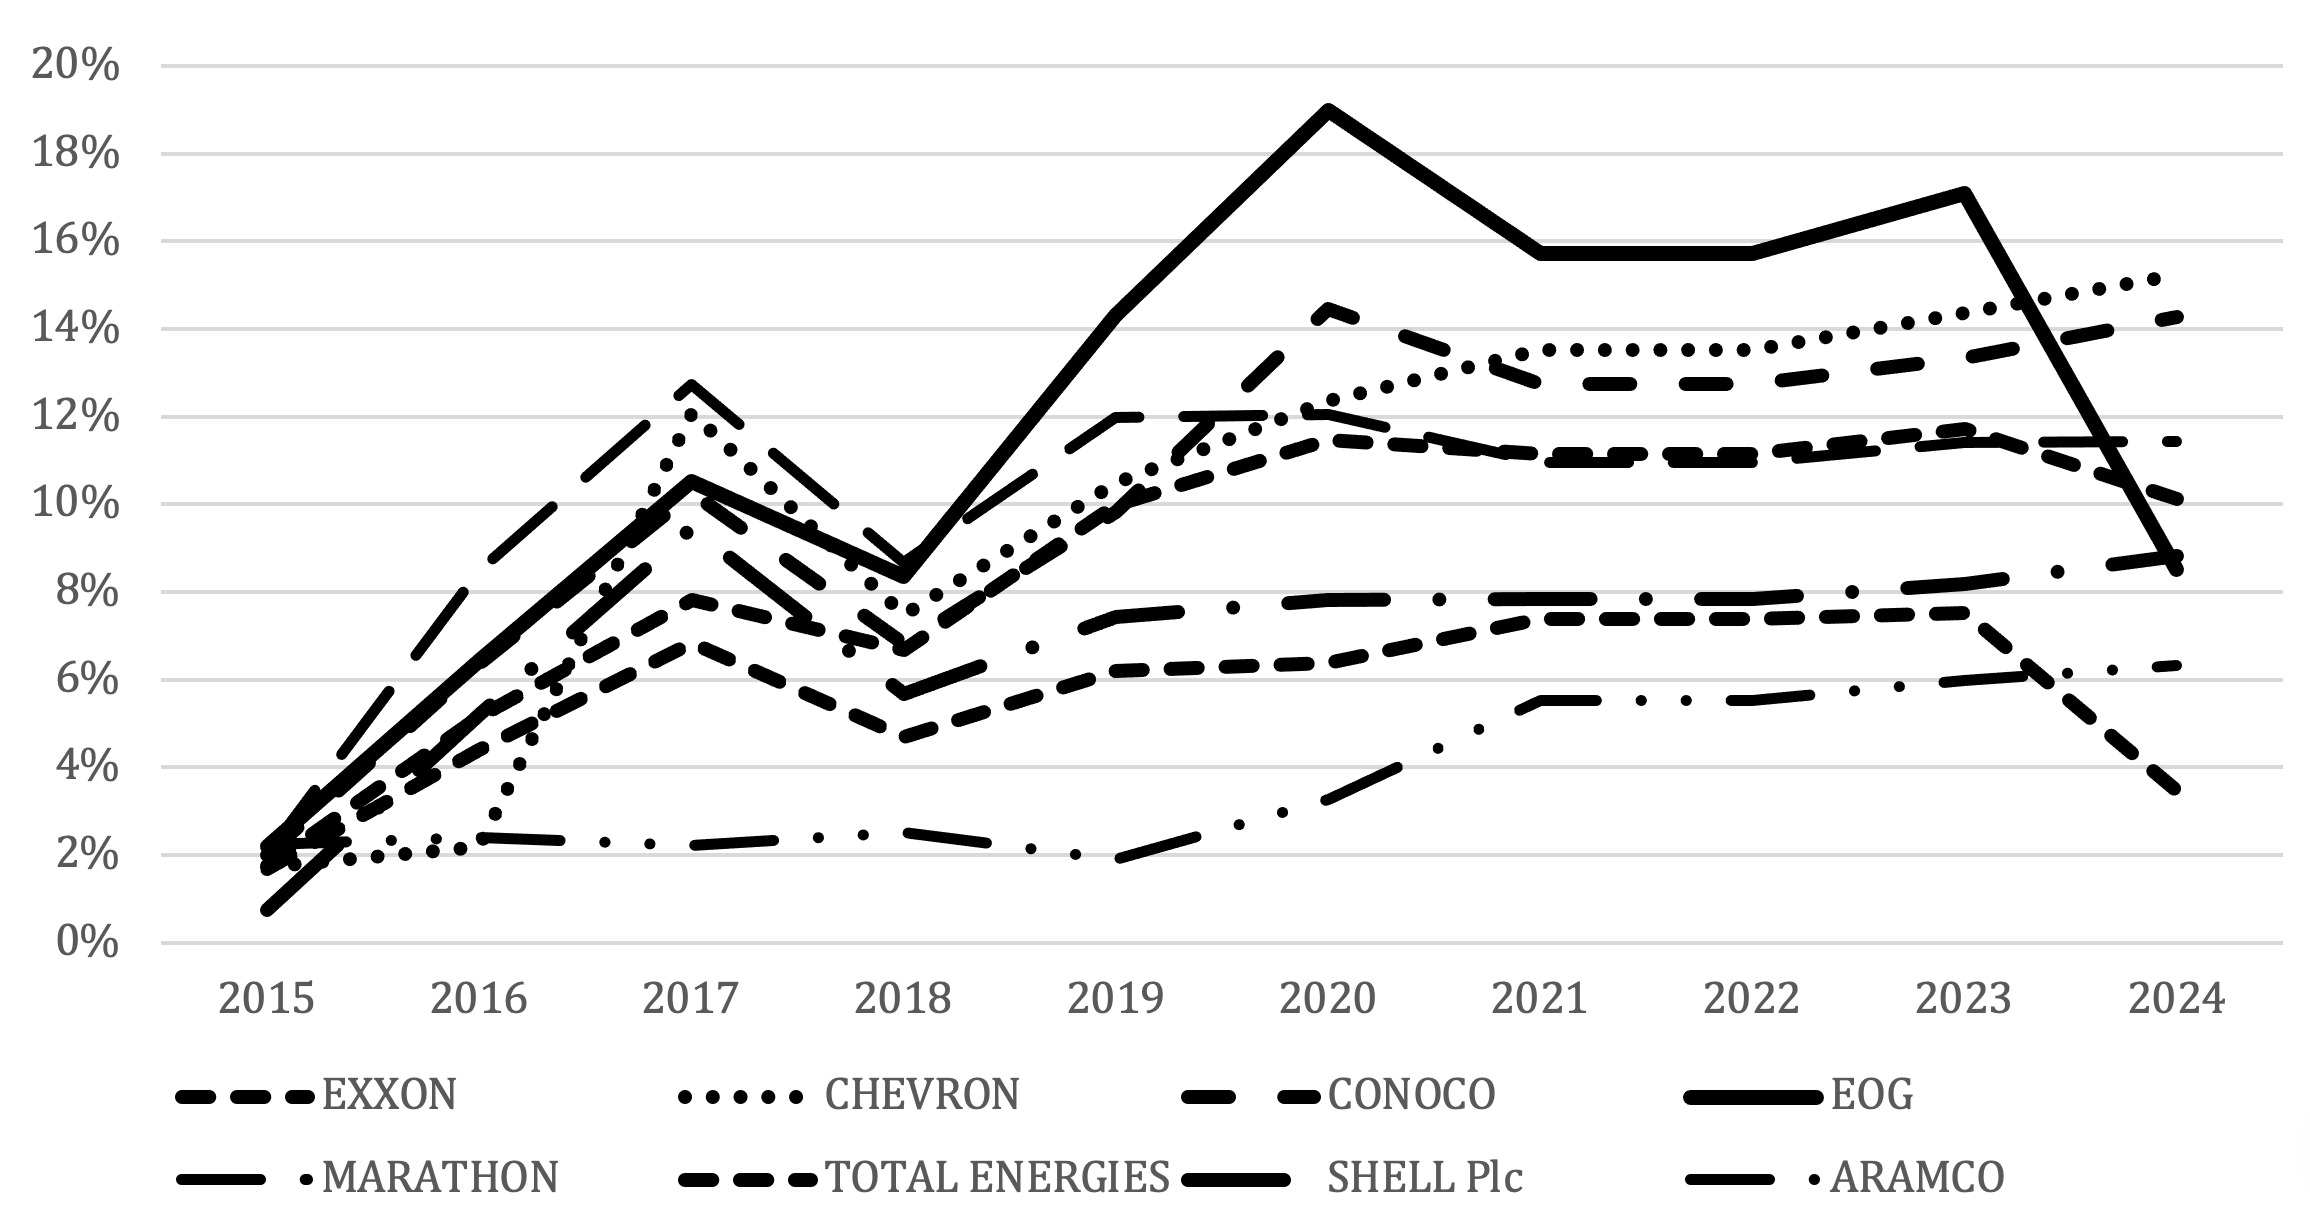
Peter used Microsoft Excel to create a multi-year WACC model to estimate each company’s cost of capital and analyze how it had shifted over time (Figure 2). The cost of equity was calculated using the Capital Asset Pricing Model (CAPM), where the risk-free rate was derived from the US 10-year Treasury yield, the market risk premium from historical equity returns, and beta coefficients from monthly stock and index returns. The cost of debt was calculated using non-current interest-bearing liabilities yield-to-maturity figures adjusted for the firm’s effective tax rate that was reported to Bloomberg for most recent year. For those years that were missing, effective tax rates were obtained from Bloomberg and ChatGPT. The company betas were estimated using the covariance between the monthly market returns of the S&P 500 and the monthly returns of the individual stock with the variance of the market returns.
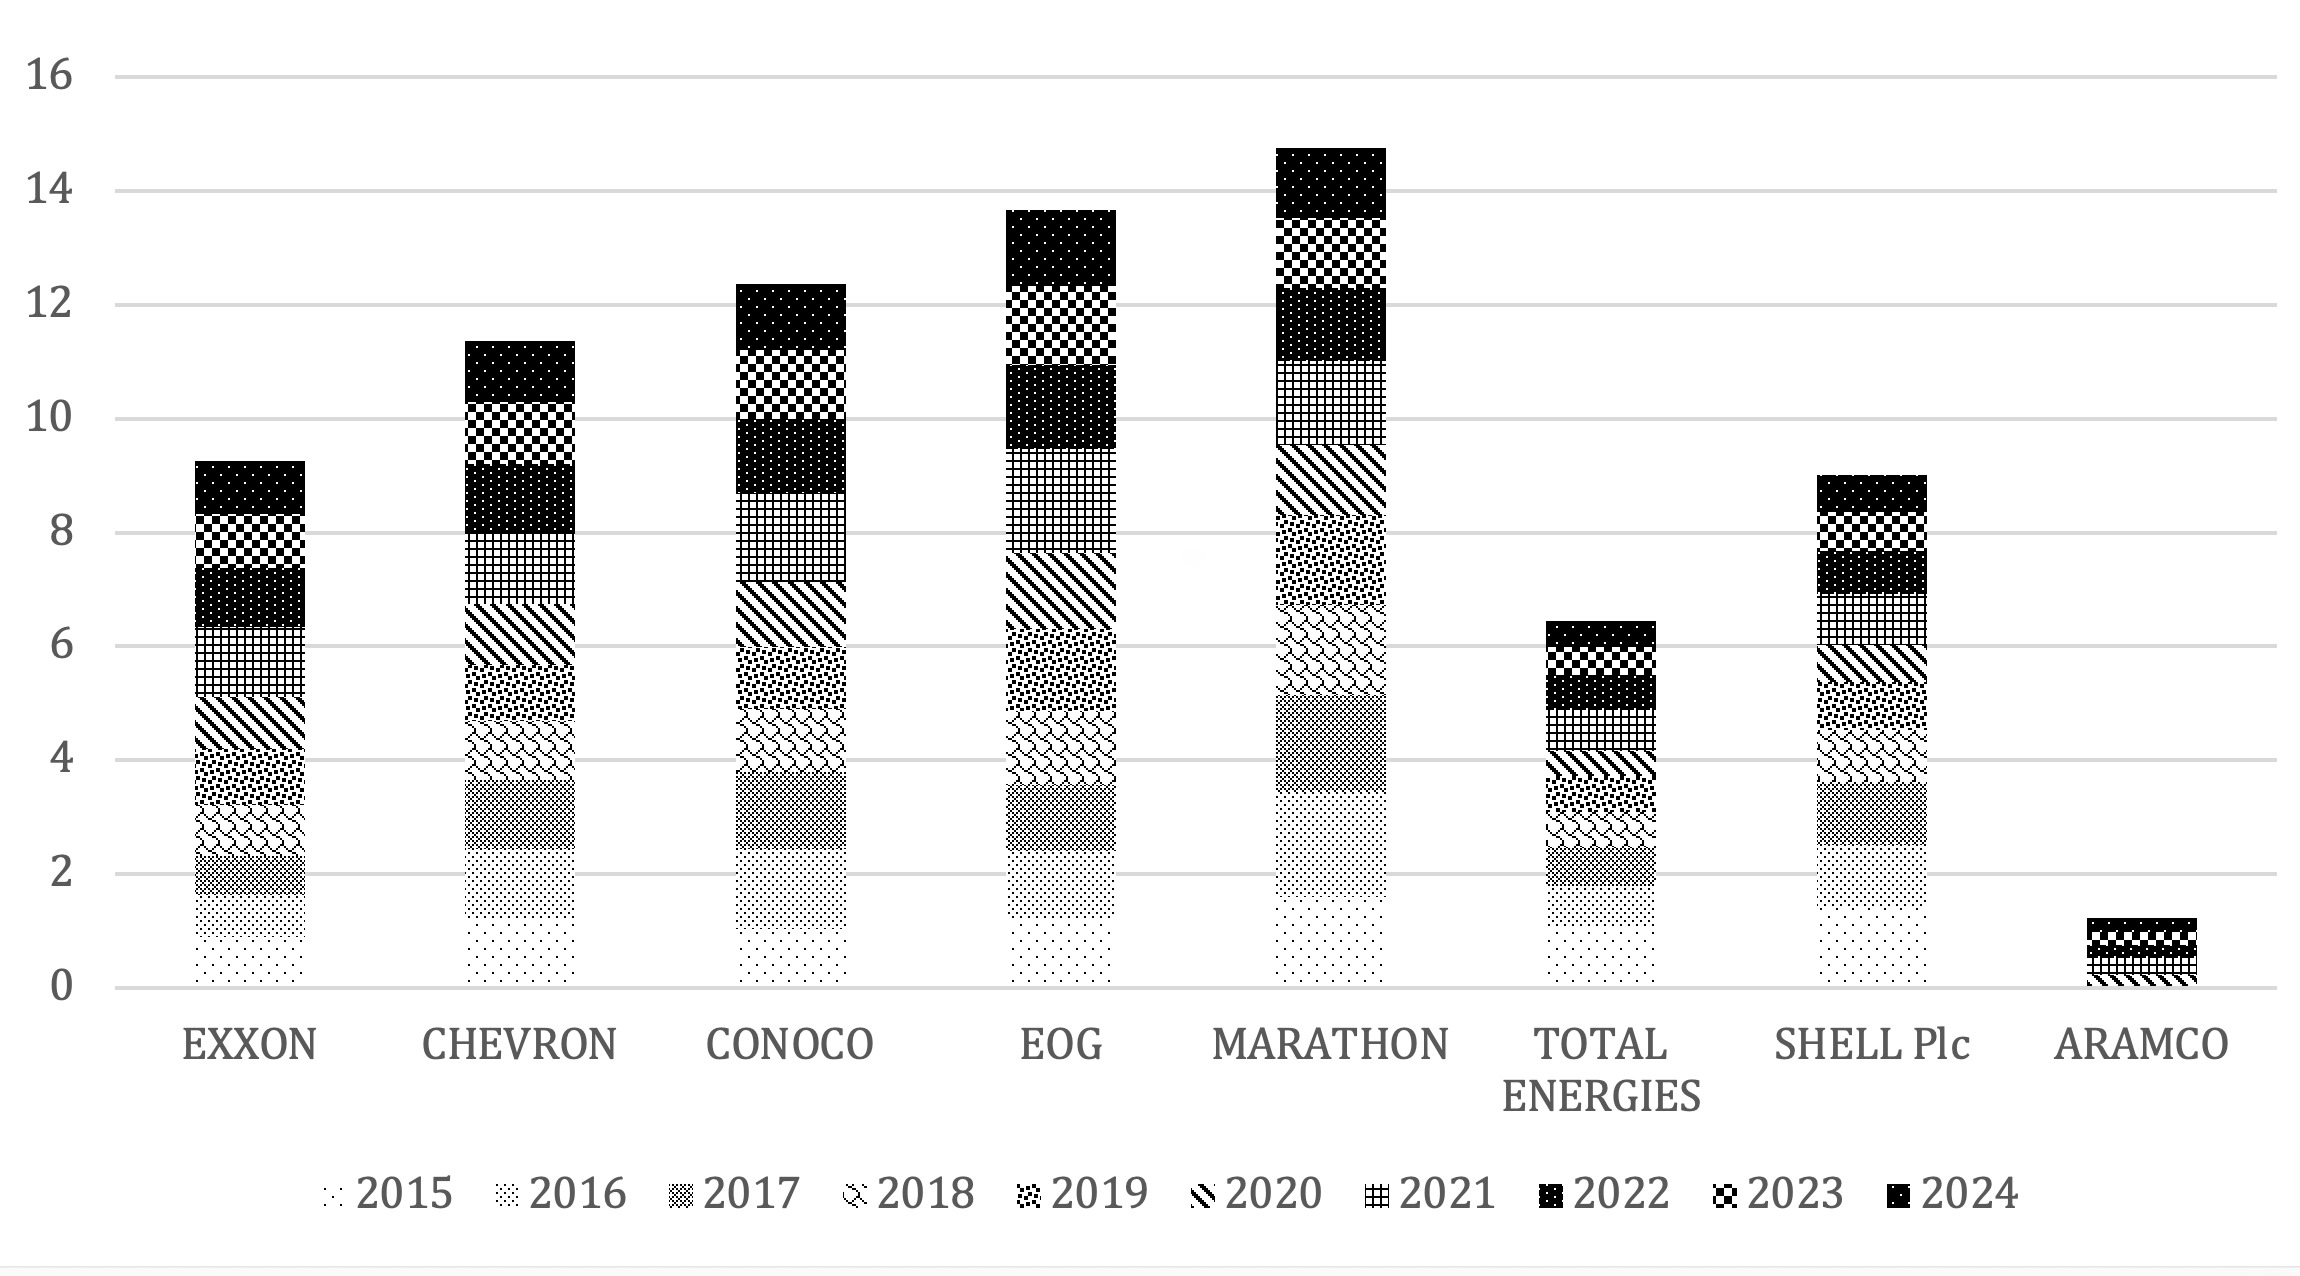
Total equity included common equity and non-controlling interests, while total debt comprised all interest-bearing non-current debt obligations. These components were weighted according to their relative proportions in the capital structure, and Peter computed an annual WACC for each company from 2014 through 2024. The spreadsheet tool allowed dynamic selection of year, automatically updating variables such as beta, equity, debt, and the risk-free rate. The resulting outputs from his spreadsheet tool included a WACC trend graph provided an empirical view of how each firm’s rate had evolved alongside financial and macroeconomic changes.
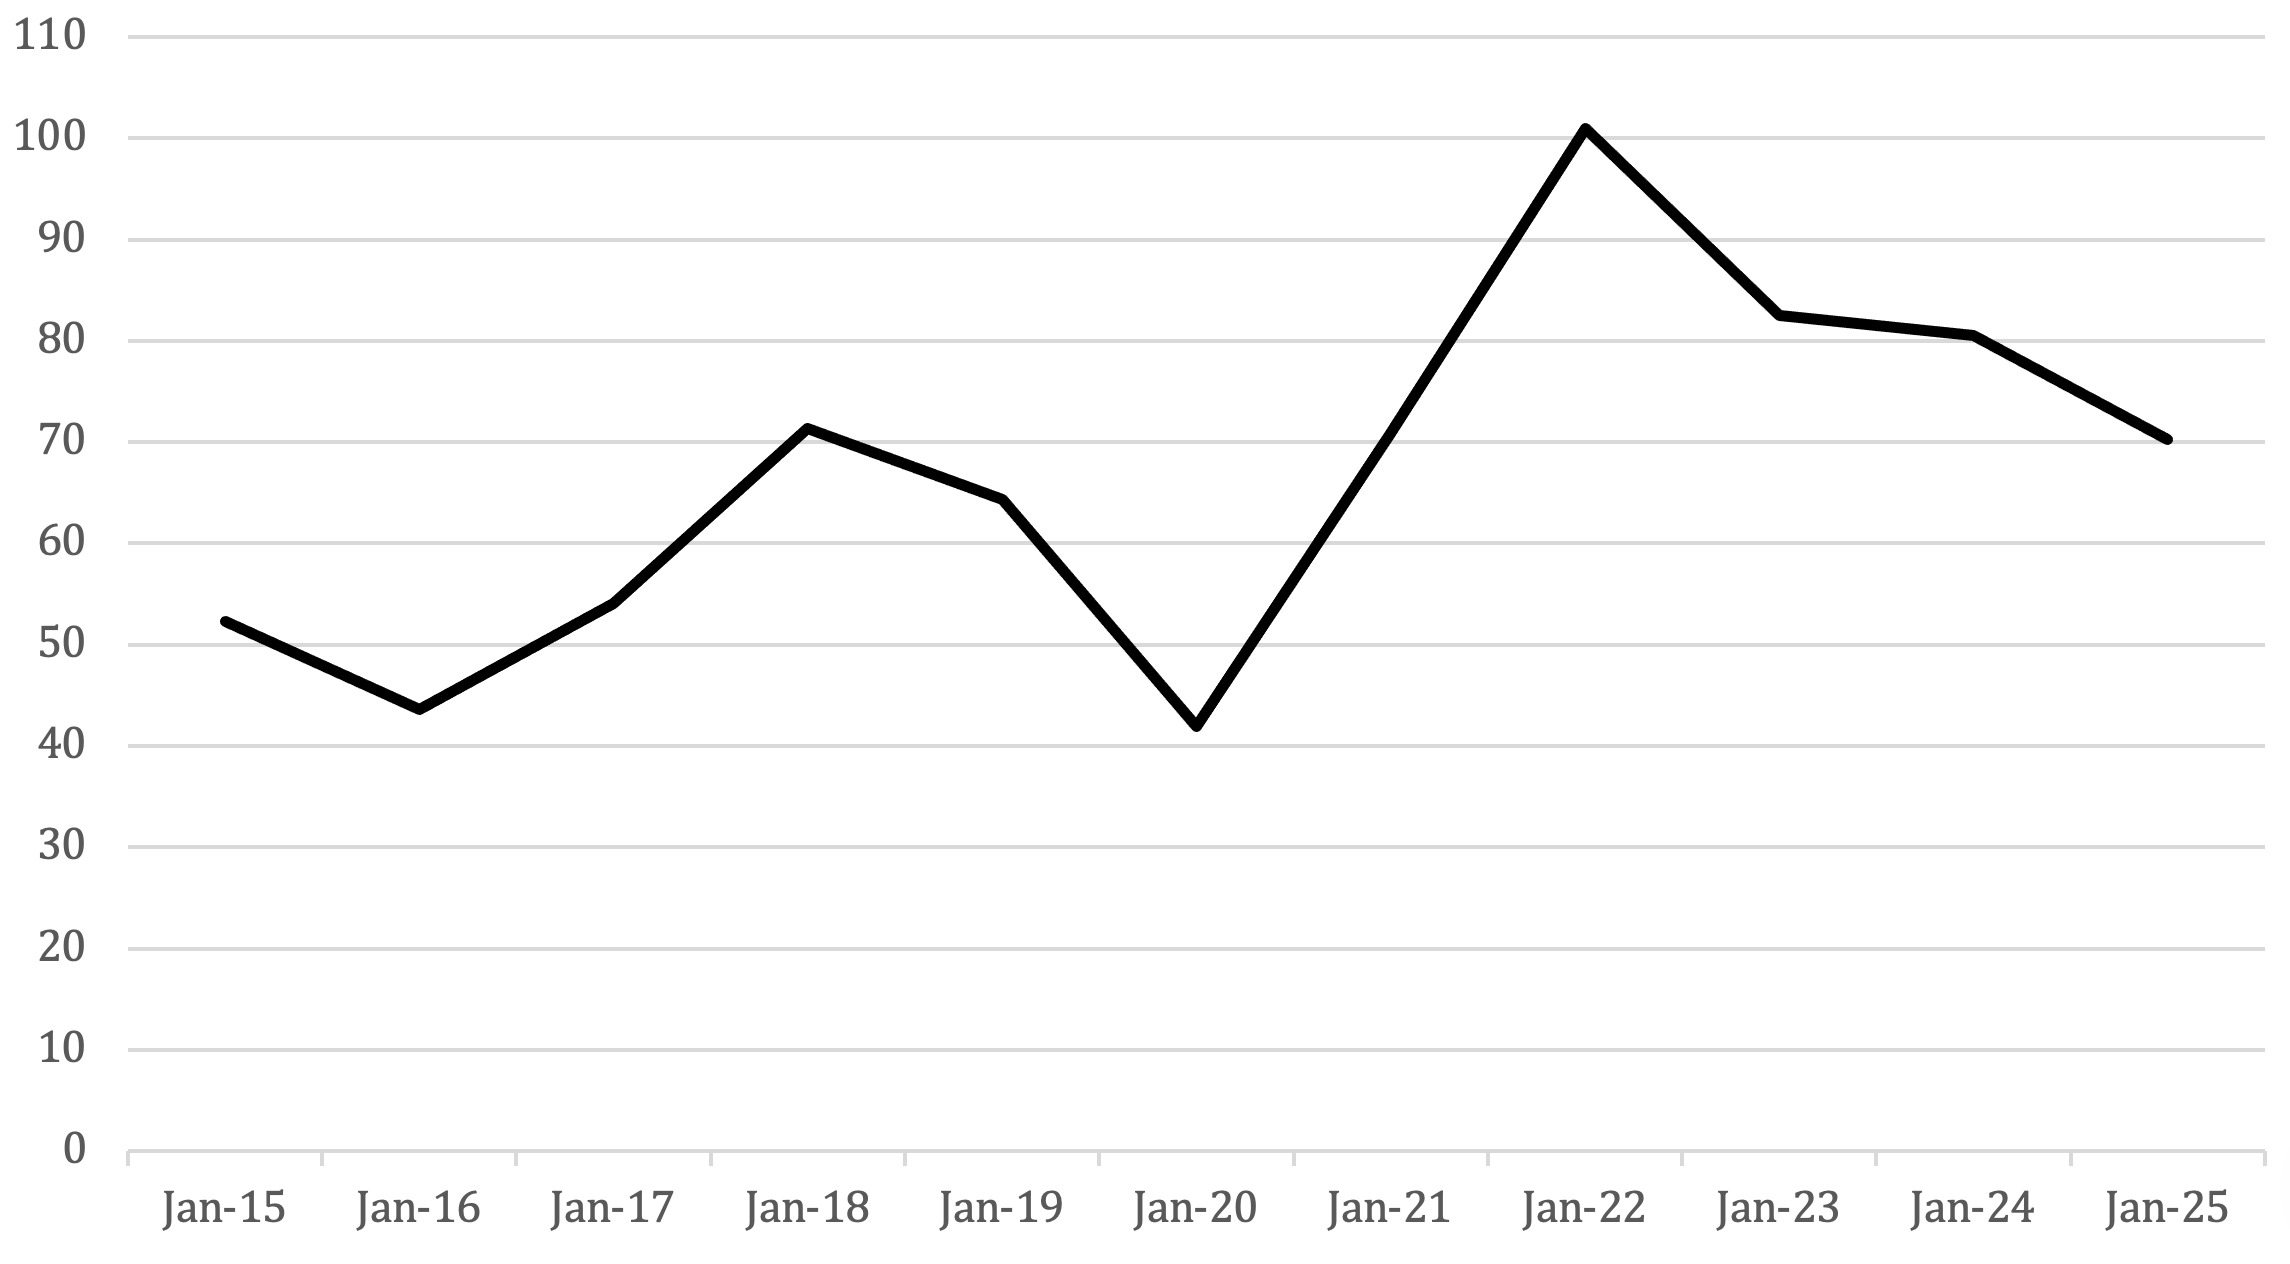
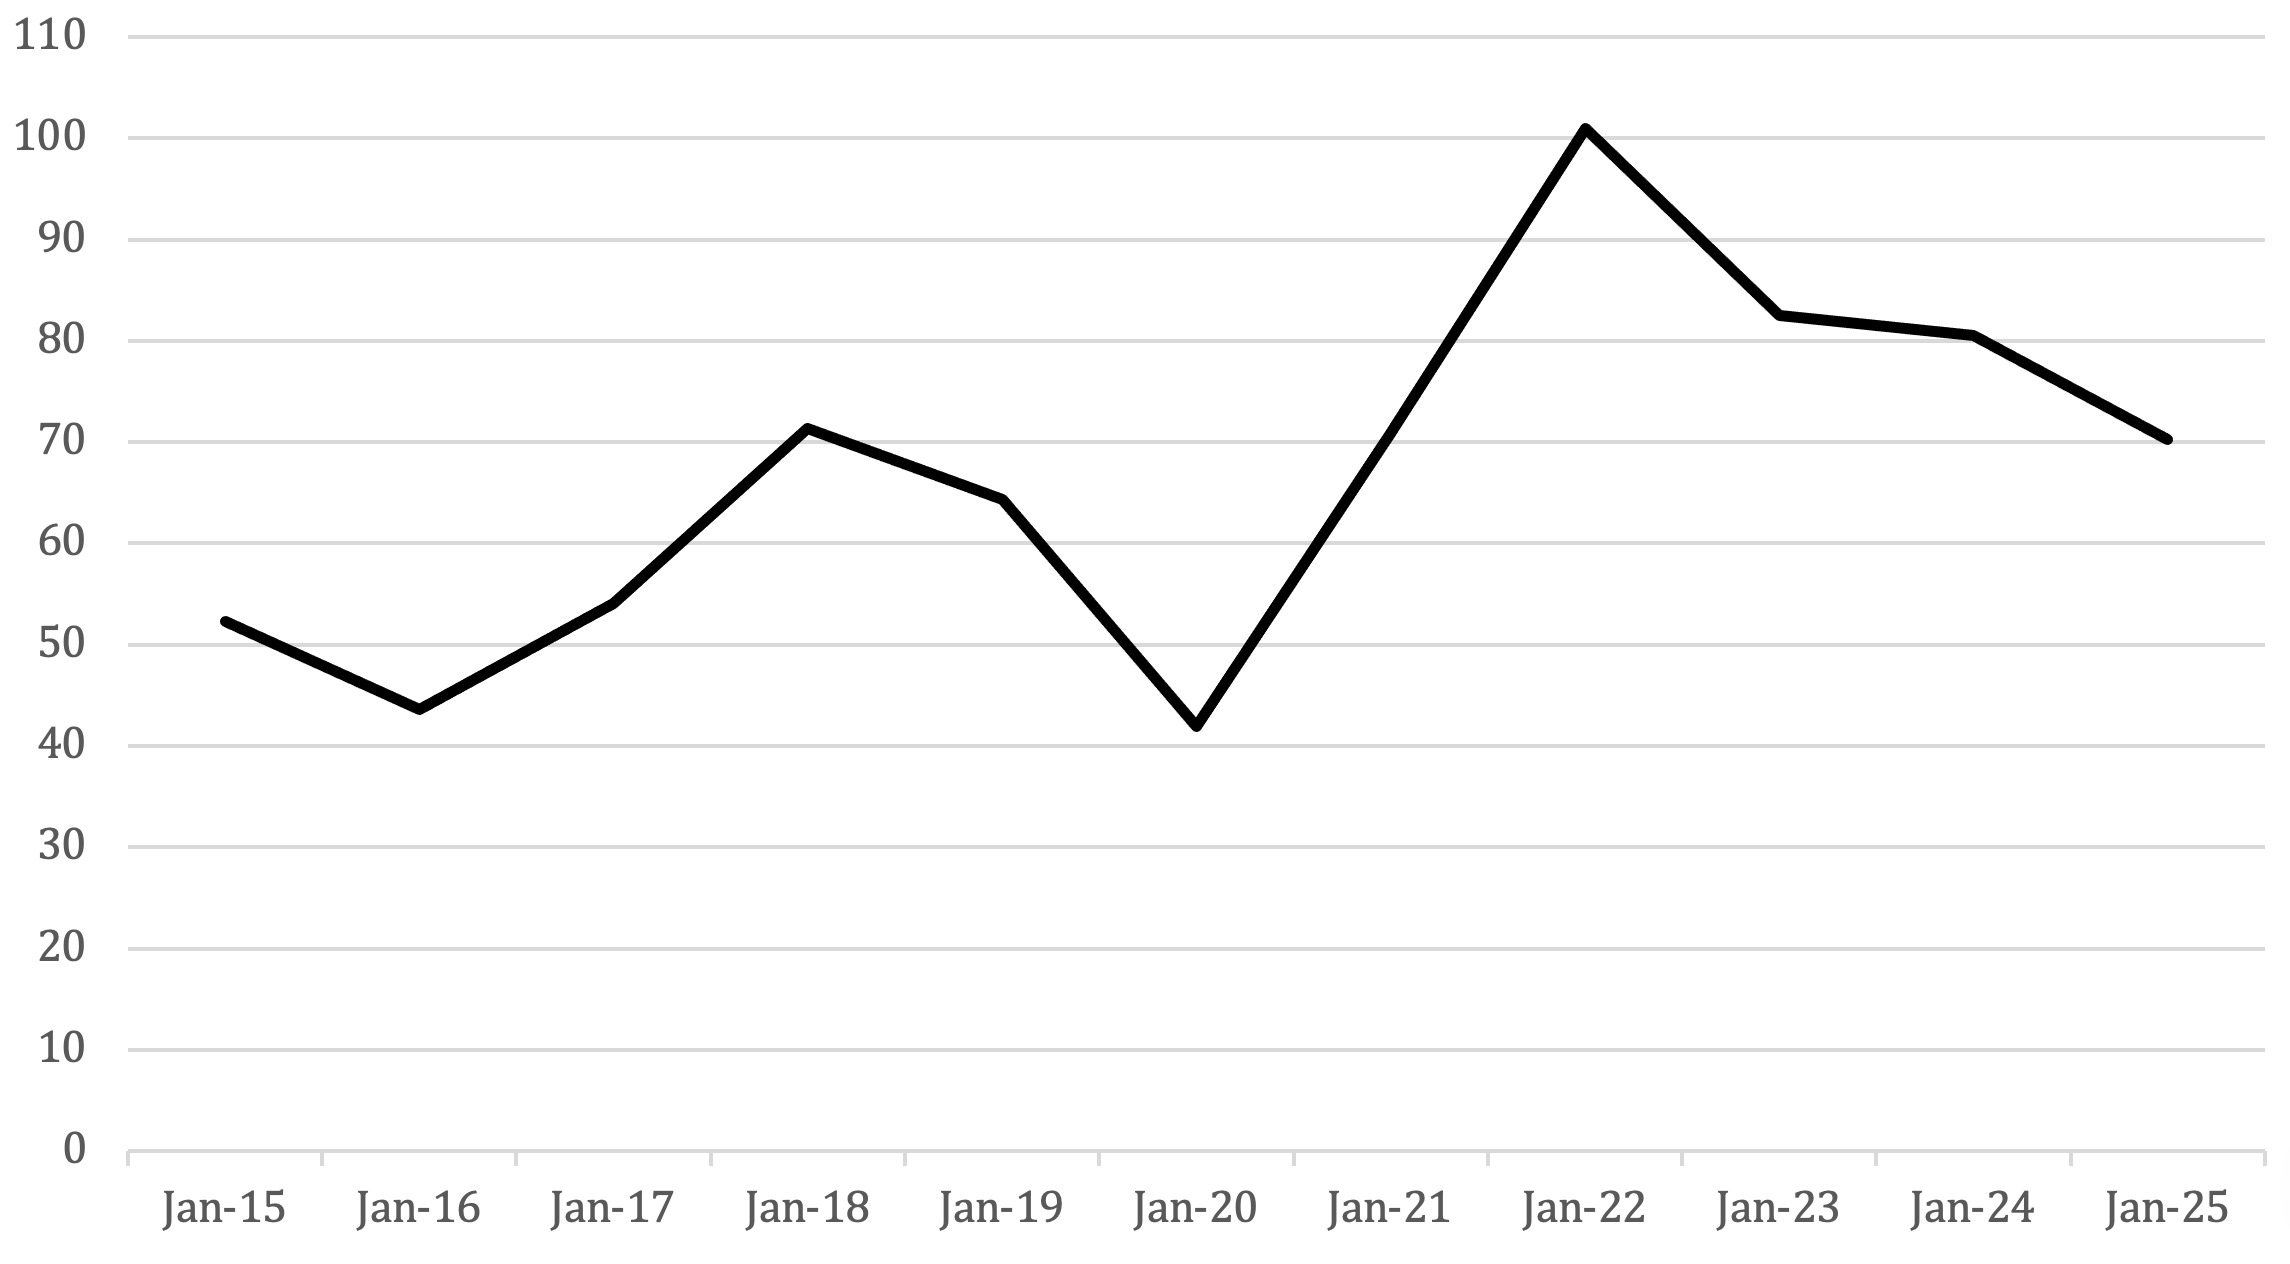
Peter wrote in his memo that an understanding of petroleum prices and their breakeven cost was critical since it was linked with the political economy of countries. Chevron (2024) noted that technological advancements such as horizontal drilling and hydraulic fracturing unlocked significant US shale oil production, contributing to the mid-2010s supply increase. Stocker et al. (2018) attributed the 2014–2016 oil price collapse initially to the surge in US shale output and later to weakening oil demand and shifts in OPEC policy (Figure 3). Teti et al. (2020) described how the oversupply led to rising betas in the oil and gas industry during 2014 to 2016. With the decline in oil and gas prices, it signaled volatility in the cashflows to financial institutions. This industry recognized that commodity prices were their biggest risk as a volatile price increased their cost of capital.
Peter decided that the discussion about the annual WACC by firms merited a separate section in the report draft since that was the variable of interest. He reminded the reader of the political crises of the 2016–2018 period caused by the US trade war with China and other countries and stakeholders’ growing interests in climate change investments. This was followed by the Covid pandemic and the resulting drop in consumption, supply chain issues, and increase in inflation.
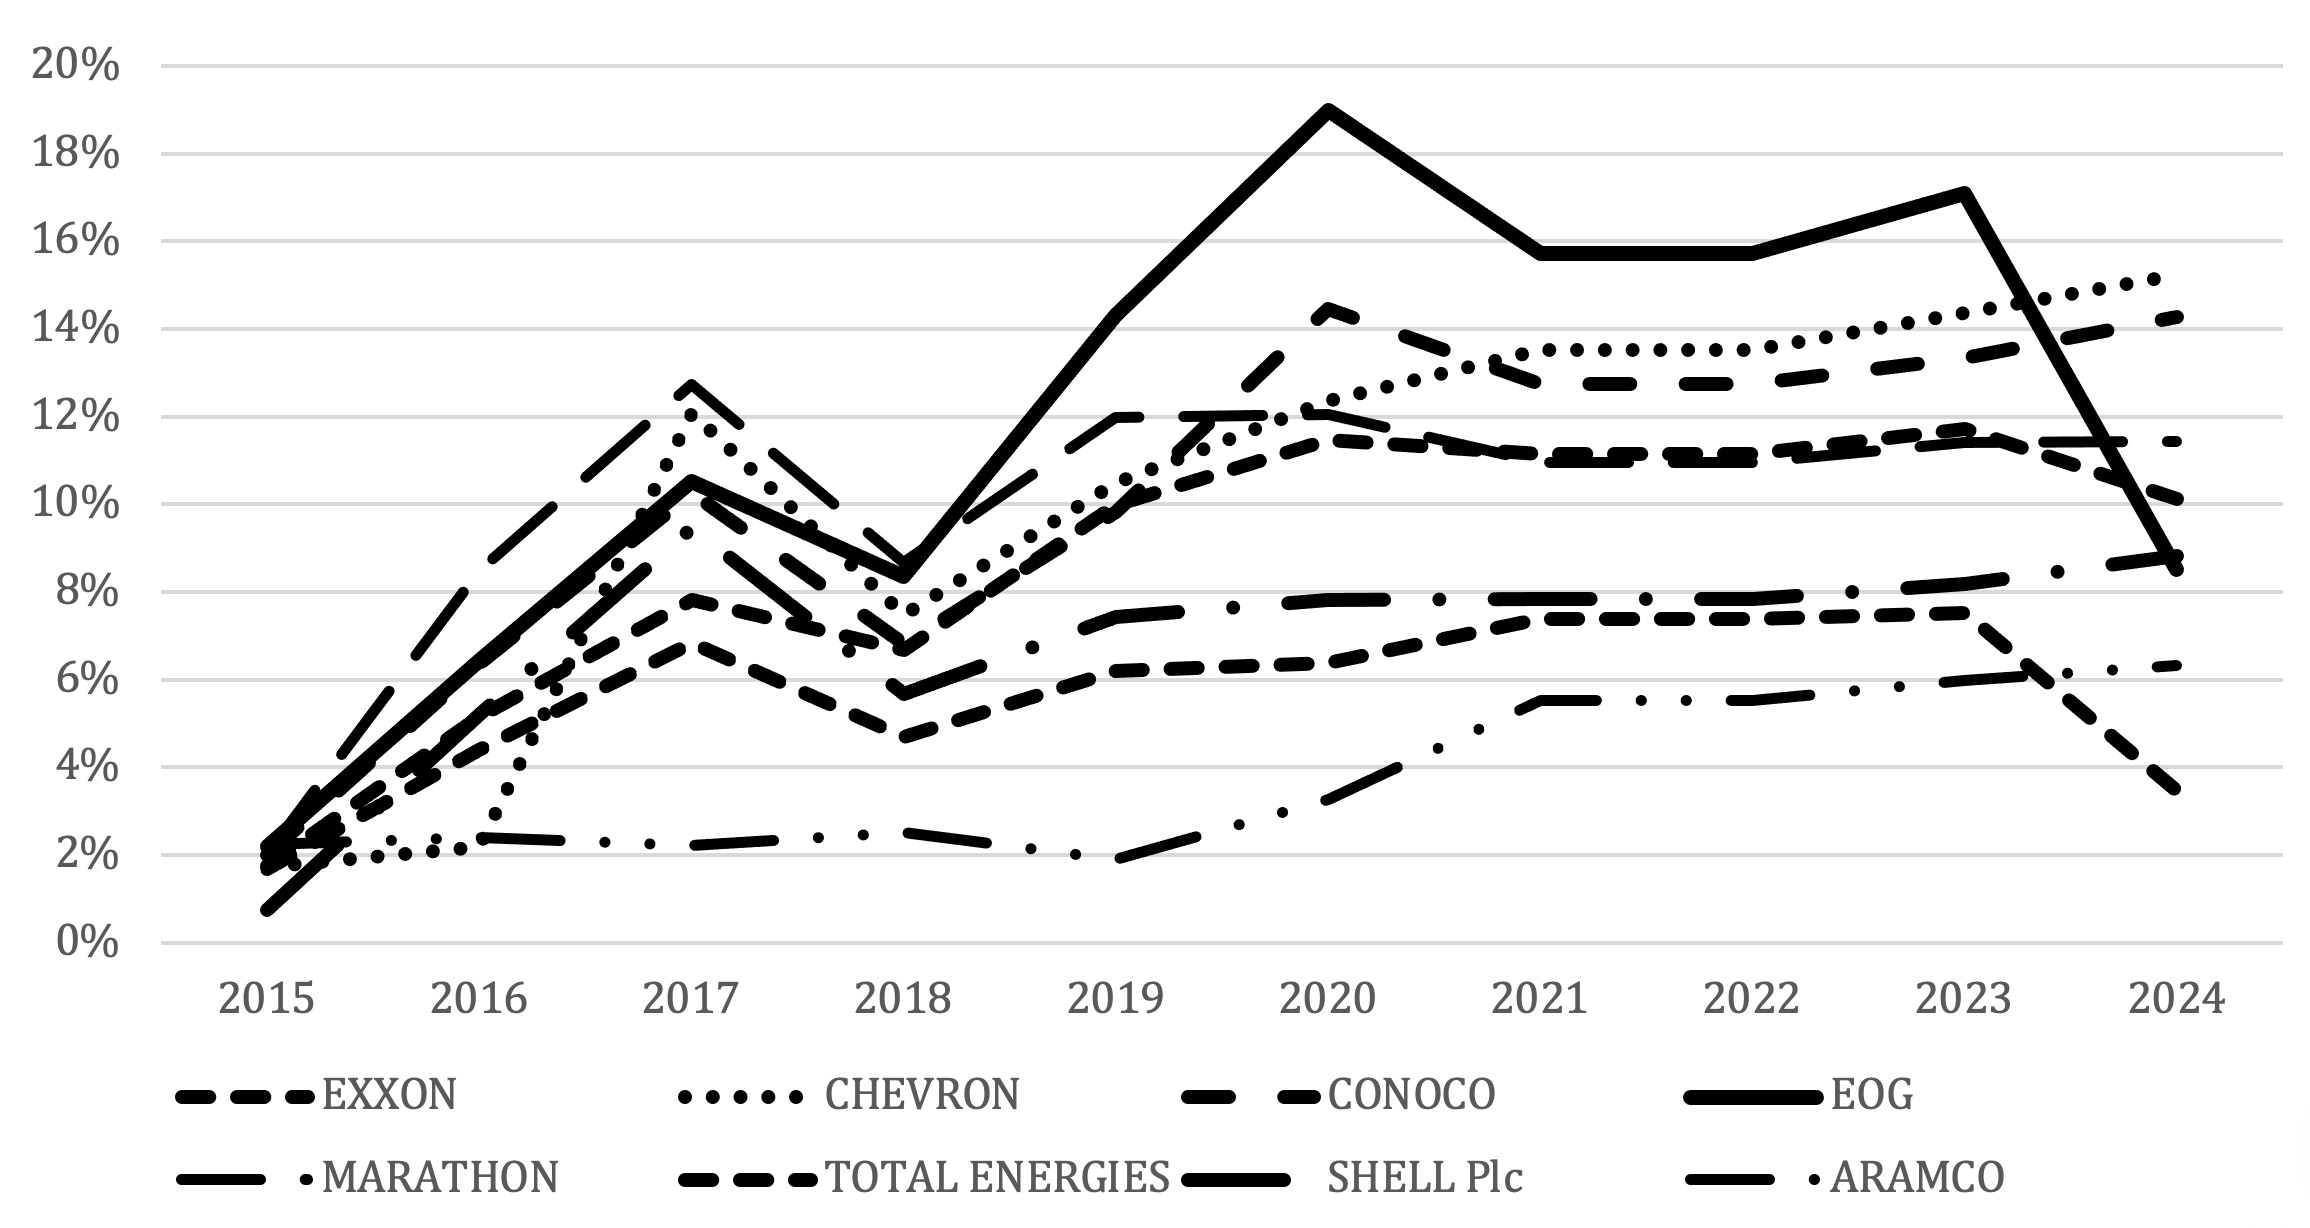
The variability in WACC was attributed to company-specific choices and circumstances, Peter pointed out in the memo draft. In 2020–2024, the industry experienced a sharp rise in betas due to the Covid pandemic, which caused a collapse in oil prices. This increase in betas did not immediately translate into higher WACC’s because governments and central banks responded by slashing interest rates. Additionally, equity market capitalization decreased, reducing debt in the firm’s capital structures (Mazur et al. 2021). In the subsequent recovery during 2022–2024, company betas stabilized and WACCs rose gradually. Two notable exceptions were EOG and Total Energies, which saw significant WACC declines in 2023, reflecting firm-specific improvements or portfolio changes in that year. Throughout the post-pandemic period, companies’ risk disclosures suggested a return to fundamental concerns, including market risk (e.g., price volatility); geopolitical and regulatory risks (e.g., resource nationalism and protectionism), and a heightened focus on cybersecurity threats.
7. Thursday
Peter was glad that his firm did not have strategic meetings late in the day or on Friday afternoons. He and his colleagues started work early. He remembered his agribusiness professor lamenting the fact that all departmental and college meetings were always done on Friday afternoons, noting that everyone who had worked hard all week was bound to be tired and crabby on Friday afternoons. “It was a good observation,” Peter thought. “I feel that way every Friday afternoon! It’s nice to be in the real world.”
“Welcome back,” Jay said. “I visited with our client earlier this morning and told him that we were making progress on their request. Peter, that means you! Talk about what you have been up to in the past week.”
Peter said, “I have been working on the WACC and have some preliminary results to show you. I did not have time to email you any links in my memo draft so I know you are seeing this for the first time, but I promise you that in the next meeting you will have my spreadsheet tools.” He shared a copy of the spreadsheet so they could see the numbers and then quickly replaced that with the figure of the WACCs.
Peter walked them through to see where the data had come from and how he had done his calculations at a higher level. “I want to make sure you understand how I got the numbers that I did.” After a lengthy 15-minute discussion with members of the group asking him questions, Peter felt that everyone was satisfied with how he had gone about calculating the WACCs.
“Now let me discuss some of the trends you see in this figure.” Peter started out by noting that the analysis of the WACC trends in Figure 4 required greater knowledge of the risk factors, but he had not finished that analysis yet and said they would have its next Monday afternoon. Overall, the trends in the two figures showed that the investment landscape in the oil and gas industry was changing. Companies were investing in renewable energy projects and pursuing acquisitions to stay relevant amid changing demand patterns. Peter walked through some examples.
He noted, “These efforts are partly driven by the rise of electric vehicles (EVs) and the growth of tech-driven energy demand. The proliferation of large data centers spurred by advancements in artificial intelligence requires massive energy supplies, and this has prompted oil exploration firms to invest in alternative energy solutions. For instance, Shell, Total Energies, Chevron, and ExxonMobil have made acquisitions or investments in areas like utility-scale solar. Shell’s purchase of Savion LLC, which was a large utility-scale US solar and energy storage developer, and Chevron’s green and blue hydrogen projects and lithium for energy storage by ExxonMobil, often in partnership with big technology firms such as Amazon and Microsoft that are seeking clean power for their data centers, are examples that indicate genuine demand for new energy sources, since existing electric grids cannot fully support such rapid growth in consumption without additional supply. None of this is surprising to any of you, I am sure.”
Peter added that, “Recently, however, there are signs of a strategic rebalancing towards core oil and gas activities, influenced by changes in policy and market signals. The US administration has rolled back certain climate and clean energy initiatives, including EV subsidies and carbon credit programs, signaling to companies that aggressive expansion into low-carbon ventures may need to be re-evaluated (CAC 2025). In 2024, Shell cancelled plans for a major $450 million biofuels plant in Rotterdam after having already shut down a sustainable aviation fuel project in Singapore, citing excessive costs and insufficient customer demand.” His slide referenced studies by Almeida (2025) and Bakr (2025). “Obviously, this impacts their WACC,” he pointed out on the figure. “Additionally, OPEC and its four observers (Canada, Egypt, Norway, and Oman) have begun unwinding production cuts while member countries expressed confidence that the market can absorb increased supply,” Peter said. “They noted that only Saudi Arabia has substantial spare capacity and project that the planned output hike would result in only about 1.7 million barrels per day of excess supply worldwide. These developments suggest a shift away from some of the more aggressive environmentally driven investments toward a focus on profitability, especially as risk factors stabilize and WACC remains elevated relative to 2016 but has steadied in recent years as you can see here.”
“What does this mean for a firm’s strategy?” Jay asked. Peter said, “I believe this shift in strategy can be partly explained by shortcomings in global climate policy. International Institute for Sustainable Development (IISD) (2024) argues that the transition to clean energy had been weak in part because the Paris Agreement emphasized demand-side measures, reducing consumption without equal attention to supply-side management (United Nations 2015). In practice, curbing fossil fuel production without reliable alternatives can harm the global economy as much as unchecked fossil fuel use. Indeed, there has been a recent uptick in fossil fuel activity, with some companies expanding exploration efforts, and many emerging economies are leaning on new oil developments to drive growth, generate tax revenue, and create jobs. All these factors are changing the dynamics of the oil and gas industry.”
“This looks good, Peter,” said a voice from the computer screen. “In the remaining few minutes, do you have any thoughts about recommendations for our client? I am impressed with what you have done so far.”
“While I am not finished with the analysis, I suspect we will recommend to our client that it is essential to consider host-country policies, market risks—especially oil and gas price volatility, technological developments, and prevailing climate policies when determining a WACC and evaluation of risk in the portfolio. Because oil and gas projects have long horizons, a continuous review of market trends is necessary. As Shell (2024) notes, the industry is in some respects waiting for clean energy investments to yield competitive returns. This information will help our client’s valuations.”
Jay laughed and said, “While our client did not ask for this, we will be remiss if we do not point out that the oil and gas sector remains stable, with lower beta volatility in recent years. Macroeconomic signals are encouraging for fossil fuels under the current president and US policy has tilted toward boosting domestic production. For example, the ‘drill, baby, drill’ political slogan aimed at reviving manufacturing and reducing cost of energy, and the expansion of AI-driven industries is contributing to robust energy demand via new data centers.”
Peter continued. “But we will point out that all these developments point to a strong outlook for energy demand and certainly renewables are part of that outlook. In sum, based on what I have found so far, while companies should continue to navigate the transition to cleaner energy, both industry players and investors must balance these efforts with the enduring reality of hydrocarbon demand and factor traditional risk considerations into their hurdle rate decisions.”
Jay said, “Great job so far, Peter. Do you suggest meeting next Tuesday? Same time work for everyone? Good.”
8. The Following Week
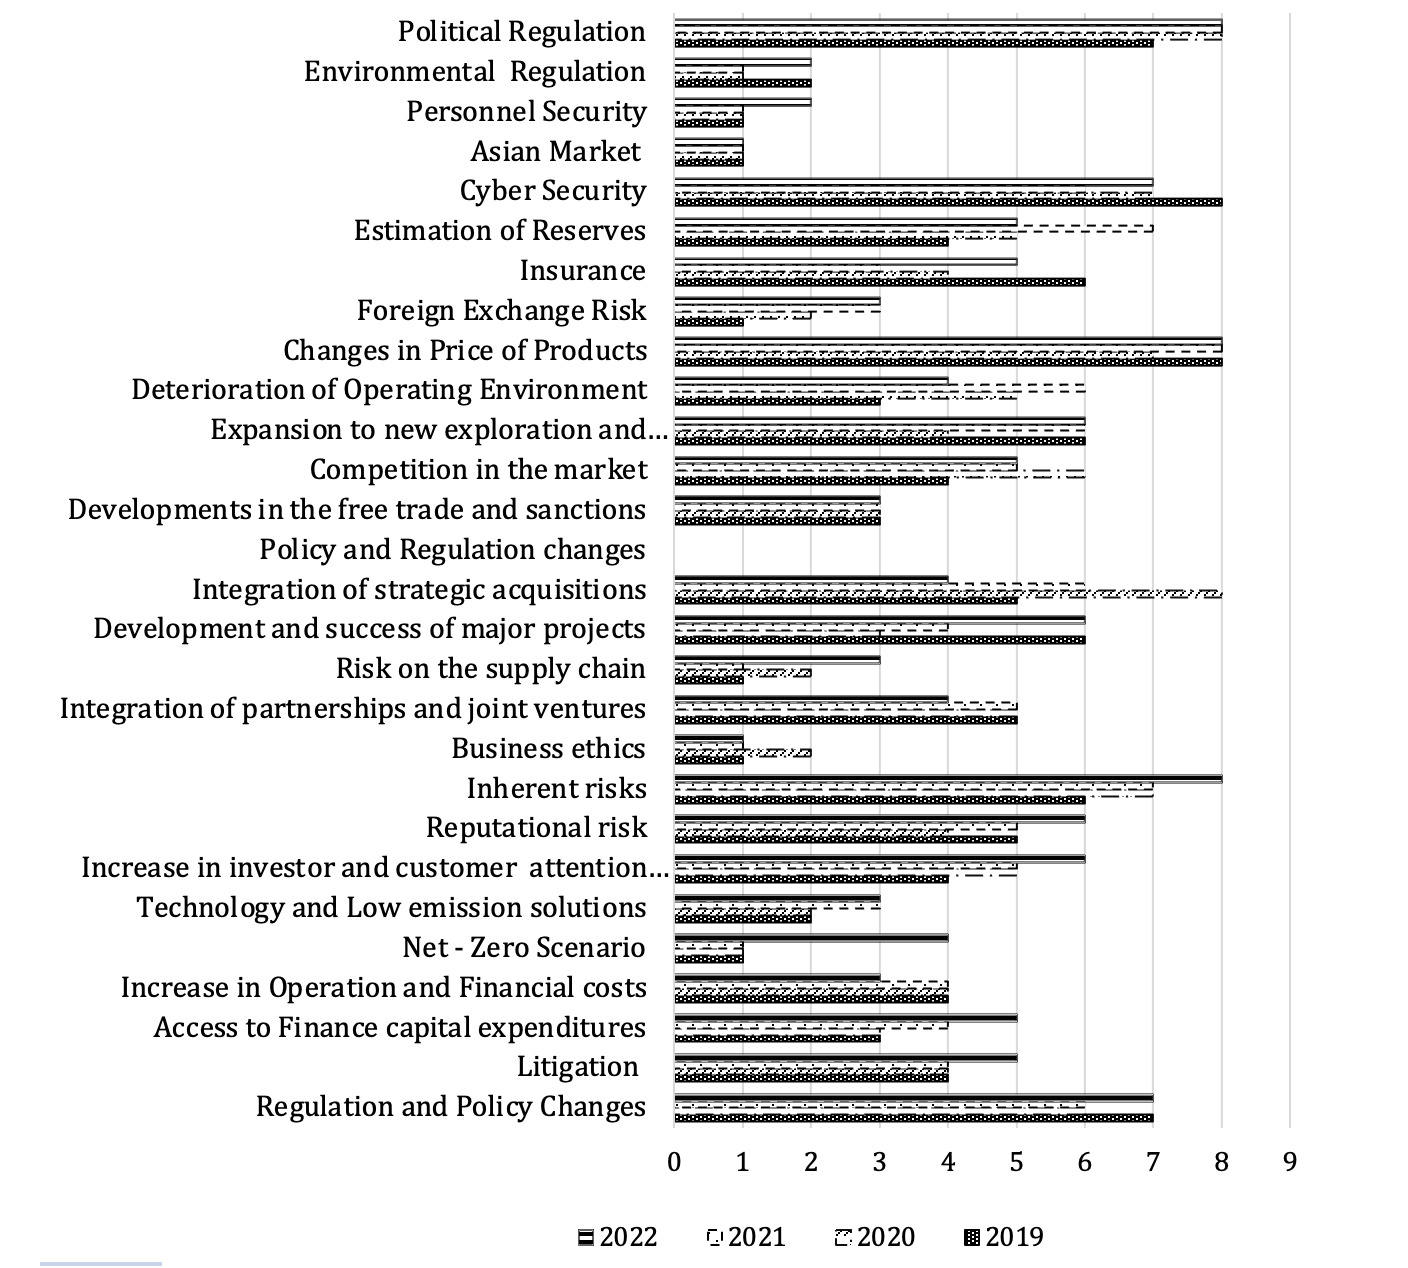
Peter made the risk assessment available to his colleagues Monday afternoon before the Tuesday meeting (Figure 5). He had been working on this project for over one week now. Because it had a direct impact on the strategy and firms during this time and thus, their WACC and its link to the client’s request, Peter had created a separate appendix on risk factors drawn from self-reported risks by each firm in their annual 10-Ks. Peter pointed out that oil and gas companies mentioned climate change as a risk, but firms declined to pursue emissions reduction investments, He wrote that climate initiatives were guided by regulatory compliance and market practicality rather than by a view of climate change as an immediate existential threat.[2] They met again virtually with some staff.
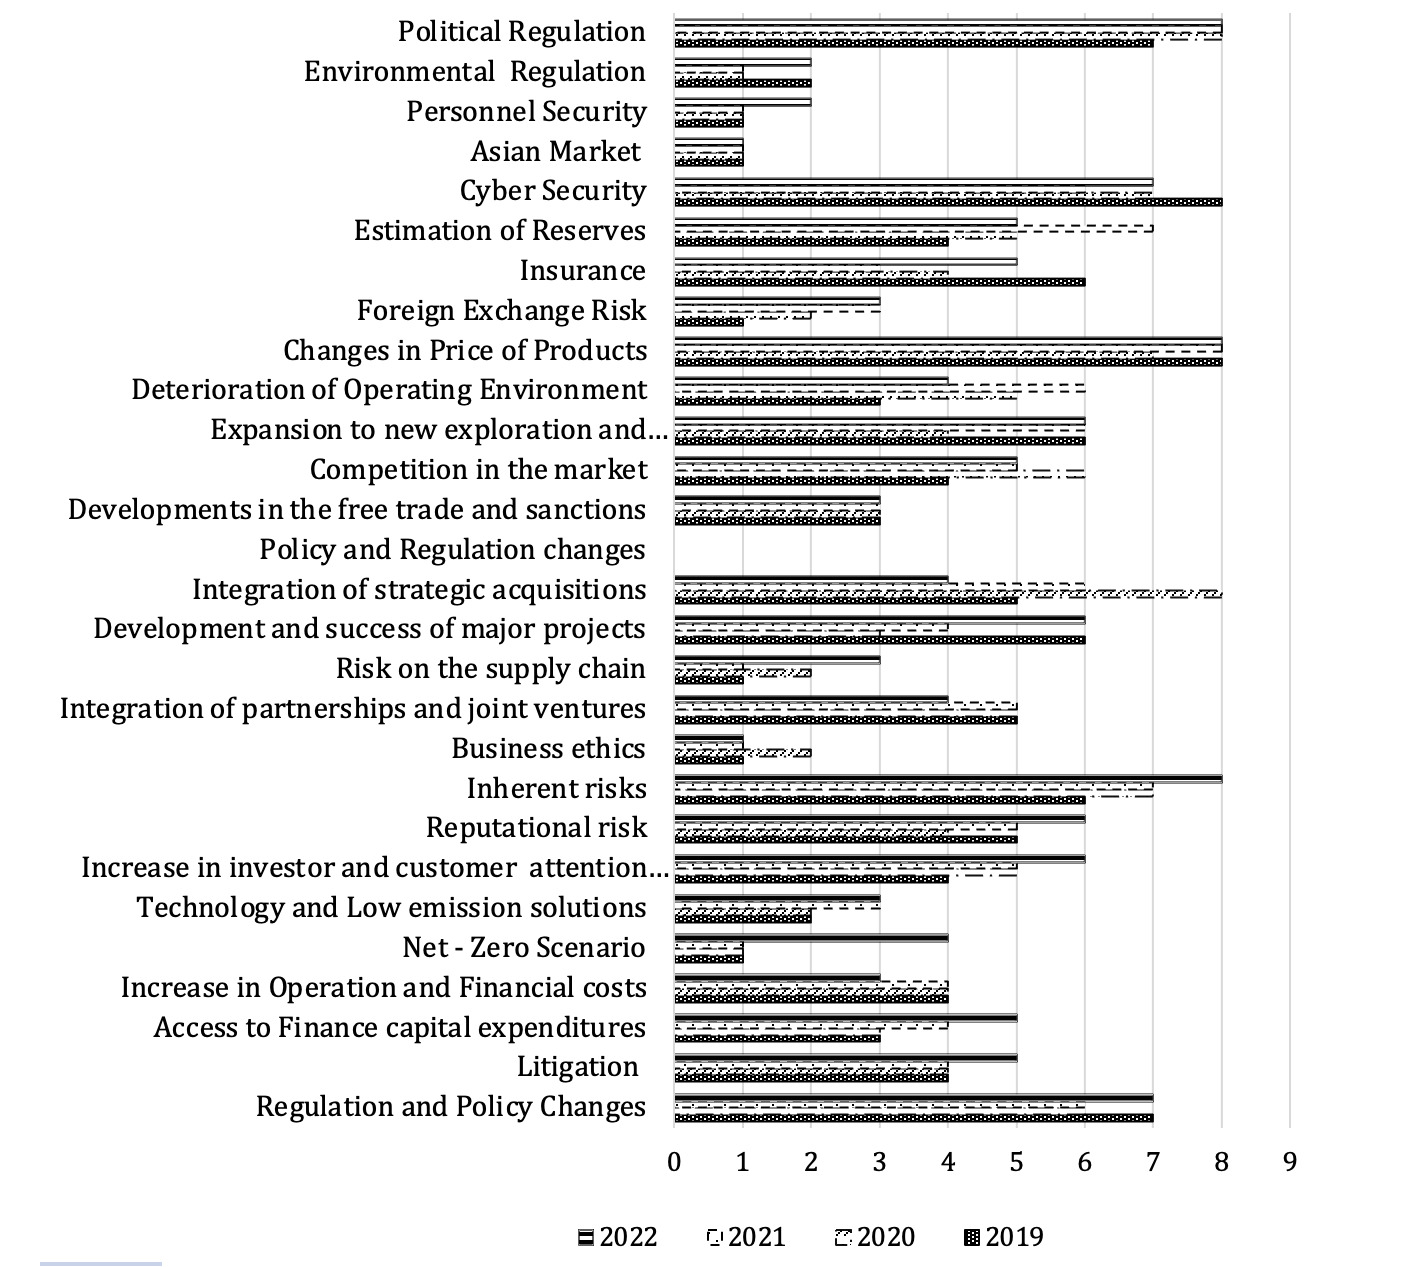
Peter told the group, “Both models, the WACC calculator and the risk map, were developed in Microsoft Excel and used interactively to generate outputs that could be cross-referenced. The WACC model provides quantitative evidence of changes in financing costs and capital structure, while the risk map translates textual risk factor disclosures into a structured dataset for visual and comparative analysis. By integrating these two perspectives, this approach helps determine the relationship between reported risks and each period’s hurdle rate. Combining quantitative rigor with qualitative context strengthens the validity of the findings, ensuring that variations in WACC are interpreted not just as financial outcomes but as reflections of broader operational and environmental risks shaping the modern oil and gas industry.”
“Well done, Peter,” Jay said. “There is a lot of work behind both figures.” Several voices came from the computer, “Here, here!” and “Bravo, Peter.” “Thanks,” Peter replied. “I want to turn your attention to Appendix A and Figure 5.”
“I drew the qualitative risk analysis drawing on risk-factor disclosures in the companies’ annual reports and 10-K filings from 2019 to 2024, a period during which all selected companies were publicly traded, since Aramco’s IPO occurred in 2019. Using content analysis, the disclosed risks were grouped into five broad categories: market and financial operations risk, operational risk, climate change risk, external risk, and geopolitical/regulatory risk. A frequency analysis in my spreadsheet tool determined the prominence of each risk based on how often it appeared as a key concern across these reports. A five-point scale was used to assess the potential impact of each risk on financial performance, operational stability, and strategic positioning, with one representing negligible impact and five representing high. Universal risks—such as commodity-price volatility, regulatory shifts, and climate-transition pressures—receive higher impact scores because of their sustained influence on profitability and investment behavior, while more controllable risks like insurance costs or business ethics are scored lower. The aggregated scoring data is visualized in an annual risk map that tracks the prominence and intensity of each risk category over time as you can see Figure A1 in the appendix.”
“Let me pause here. I know this was emailed to you yesterday, but you may not have had time to digest it.” Peter waited for 5 minutes and then asked, “What information am I missing for our client?” Jay said, “Peter, I made a few notes in advance of this meeting for things we need as we compile a draft. Let me read those off.”
-
Our client wants to understand the tradeoffs in investments between traditional fossil fuel and so-called green or low carbon investments. One way is to understand the WACC. What is the average WACC for this industry and these types of investments?
-
The trend line over time for WACC in these firms reflects industry and firm conditions. What does the variability in the trend line mean relative to an industry average?
-
What is the role of the equity risk premium regarding the WACC for oil exploration firms and so-called green or low carbon investments? The changing portfolio of the eight firms suggests that external and economic obsolescence or stranded assets is an issue here. What do we say to our client about this issue?
-
Our client has not asked us for explicit recommendations but a report on the industry as they consider potential investments. But it is logical to assume that they will ask for it and even commission another study from us. What should we say?
9. Discussion Questions
-
How should an analyst collect and standardize data on company strategy, investment decisions, and financing structure across the selected oil and gas firms?
-
How should risk factors be identified, categorized, and compared across firms in the oil and gas industry?
-
How should analysts interpret differences in reported “key risks” across firms, and what implications do these differences have for investment decisions?
-
How should the WACC be estimated for firms in the oil and gas industry, and what methodological considerations arise in the process?
-
Based on the evaluation of firm strategy, risk exposure, and cost of capital, what investment recommendation should be made to the client?
About the Authors
Peter Sematiko is a former graduate student in the College of Business and Michael A. Boland is a professor of agricultural economics and AgCountry Endowed Professor in Agribusiness at North Dakota State University.
AI Disclosure
The authors used ChatGPT, developed by OpenAI, between September and December 2025 to assist with methodological explanations, interpretation and review of WACC spreadsheet calculations, discussion of effective tax rates and tax benefits, organization of company-risk categories, summarization of company filings and strategies, reference-format review, and drafting and language editing. The tool did not determine the research design, findings, or conclusions. The authors reviewed and revised AI-assisted content and retained full responsibility for the data, calculations, source verification, analysis, citations, interpretations, and final manuscript. Where the available interaction record does not demonstrate independent verification of an AI-suggested figure against a filing or database, no such verification is claimed.
Human Subjects Disclosure
None applicable
These are contained in the appendix in the teaching note.
Shown in the Teaching Note appendix.