1. Introduction
California agriculture depends heavily on immigrant labor to sustain the production of labor-intensive commodities such as fruits, vegetables, grapes, and nursery products (US Department of Labor 2022). Across many of the state’s major agricultural regions, farmworkers—many of whom are foreign-born and a substantial share of whom lack legal work authorization—perform essential planting, pruning, harvesting, and packing activities that are difficult to mechanize or replace. In recent months, US immigration enforcement activity has intensified, creating new concerns for the agricultural industry (White House 2025).
A growing body of research has documented persistent labor scarcity in US agriculture and the increasing challenges farmers face in recruiting and retaining workers (Hertz and Zahniser 2012; Fisher and Knutson 2013; Fan et al. 2015; Richards 2018; Rutledge and Mérel 2023; Win et al. 2025). However, less is known about how immigration enforcement specifically contributes to labor disruptions and how farmers respond when labor losses occur. Despite anecdotal reports from the popular press that heightened immigration enforcement is exacerbating farm labor scarcity, empirical evidence remains limited. This study helps fill that gap by providing systematic evidence on the prevalence of immigration enforcement-related labor disruptions, how these disruptions vary across regions and commodity groups, and the strategies farmers use to adapt. In practice, producers may adapt through a variety of strategies, including hiring through farm labor contractors, raising wages or offering new incentives to retain workers, shifting to the H-2A temporary agricultural worker program, or scaling back production. The feasibility of these strategies likely varies by commodity type and region, reflecting differences in labor intensity, seasonality, crop perishability, and operational flexibility. Understanding these differences is important for identifying where labor disruptions are most severe and what types of adjustment strategies are most viable.
2. Data
This study draws on original data from the California Farmer Immigration Enforcement Survey, administered in late 2025 and early 2026 through a collaboration between the California Farm Bureau Federation and Michigan State University. The survey collected information on farmers’ experiences with immigration enforcement, labor disruptions associated with enforcement activities, and the strategies producers used to adapt to resulting workforce challenges. A total of 482 farmers responded with usable answers, representing 50 of California’s 58 counties, providing broad geographic coverage across the state’s major agricultural regions and commodity-producing areas. In addition to structured survey questions, the survey instrument included open-ended responses that provide qualitative context on producer experiences and operational adjustments.
Using these data, we examine how immigration enforcement affects agricultural labor availability and farm operations across California. Specifically, we document both direct and potential off-farm and indirect enforcement-related experiences, analyze how these effects vary across regions and commodity groups, and assess the strategies farmers adopt in response to labor losses. By identifying where labor disruptions are most concentrated and how producers are adapting, the analysis provides timely evidence to inform farm labor management decisions, extension programming, and policy discussions surrounding the future of California’s agricultural workforce.
As with any voluntary survey, the findings should be interpreted with appropriate caution. Their broader applicability depends on the representativeness of participating farmers and the extent to which respondents differ systematically from nonrespondents. Because the survey concerns immigration enforcement and the employment of potentially unauthorized workers, some producers may have been reluctant to participate or to fully disclose their experiences despite assurances of confidentiality. If farmers who rely more heavily on unauthorized workers were less likely to respond, the survey may understate the prevalence and severity of immigration enforcement-related labor disruptions. Accordingly, the results are best understood as descriptive evidence of a sample of producer experiences rather than fully representative estimates for all California farmers.
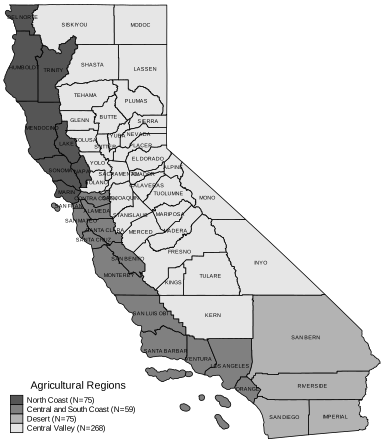
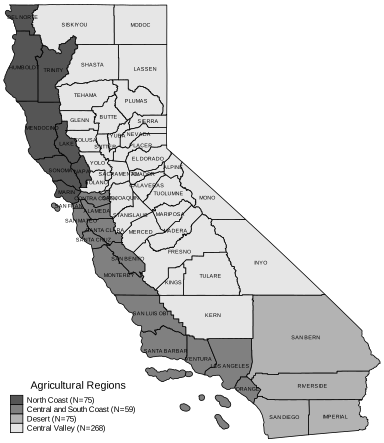
To examine how farmers’ experiences and adaptation strategies vary across contexts, we categorize the sample by both region and commodity type. Specifically, we divide the sample into four main California regions—North Coast, Central and South Coast, Desert, and Central Valley. Figure 1 depicts the sample distribution across California’s major agricultural producing regions.
We also classify farms into four commodity groups based on the primary crops produced by the respondents in the past 12 months of the survey, including (i) fruits, vegetables, and ornamentals; (ii) grapes; (iii) dairy and livestock; and (iv) other non-labor-intensive crops. This classification is based on differences in production patterns and crop composition, reflecting that labor demand, seasonality, and reliance on hired workers vary substantially across regions and commodities, which in turn shape farmers’ exposure to labor shocks and their ability to adapt. Table 1 provides detailed information on the counties and commodities included in each category, along with their respective sample sizes.
3. Experiences with Immigration Enforcement by Region and Commodity Group
Farmers’ experiences with immigration enforcement varied substantially across California’s agricultural regions (see top panel of Table 2). Across the full sample, only two farmers reported direct immigration enforcement activity on their farms. However, one in four farmers reported experiencing at least one negative consequence related to immigration enforcement.[1]
Farmers in the Central and South Coast region—home to major berry and leafy green production—reported the highest rate of negative experiences, including labor losses, operational disruptions, and heightened fear and anxiety. Forty-one percent of farmers in this region reported at least one negative effect, substantially above the statewide average of 26 percent. Anxiety and fear were the primary contributors to this elevated rate: 25 percent of farmers reported experiencing anxiety or fear, and 19 percent reported labor losses attributable to workers’ concerns about immigration enforcement. An additional 12 percent reported operational disruptions linked to enforcement-related uncertainty.
Farmers in the North Coast region, which includes California’s premier wine-producing counties, reported the highest rate of immigration enforcement-related labor losses (25 percent). However, none reported direct enforcement actions or farm raids, indicating that these labor losses were driven by either off-farm enforcement or by fear and uncertainty. Overall, one-third of farmers in this region reported at least one negative effect, including 11 percent reporting operational disruptions and 5 percent reporting general anxiety or fear.
In the Desert region, known for winter vegetables, melons, and other specialty crops, 15 percent of farmers reported labor losses associated with worker fears about immigration enforcement, while 12 percent reported operational disruptions. Although no respondents reported farm raids or direct enforcement activity, 8 percent reported experiencing general fear or anxiety about the possibility of enforcement.
California’s Central Valley region, encompassing both the Sacramento Valley and the San Joaquin Valley, produces a diverse range of crops, including grapes, nuts, tomatoes, and various fruits and vegetables. Farmers in this region reported the lowest rate of labor losses, with approximately 10 percent indicating labor losses related to immigration enforcement or enforcement-related anxiety. Operational disruptions were reported by 5 percent of respondents, while 7 percent reported experiencing anxiety or fear.
Farmers’ experiences with immigration enforcement also varied considerably across commodity groups (see bottom panel of Table 2). At least one adverse outcome—including labor loss, operational disruptions, or anxiety—was reported by 36 percent of fruits, vegetables, and ornamental growers, 33 percent of grape growers, 19 percent of dairy and livestock producers, and 16 percent of non-labor-intensive crop producers. Compared to the overall average, these shares are higher for fruits, vegetables, and ornamental growers and grape growers, and lower for dairy and livestock producers and non-labor-intensive crop producers.
General labor loss was most prevalent among grape growers, with approximately 21 percent reporting such experience. Fruits, vegetables, and ornamental growers followed at 19 percent, dairy and livestock producers at 13 percent, and non-labor-intensive crop producers at 8 percent. Consistent with regional patterns, the share of farmers experiencing direct on-farm enforcement visits was low across all commodity groups.
Beyond labor loss, operational disruptions were most commonly reported by fruit, vegetable, and ornamental growers (13 percent), followed by dairy and livestock producers (8 percent), grape growers (7 percent), and non-labor-intensive crop producers (4 percent). A similar pattern emerged for anxiety and fear, with 12 percent of fruit, vegetable, and ornamental growers reporting this experience, compared to lower shares among other groups. These findings underscore that the burden of immigration enforcement falls disproportionately on producers of labor-intensive commodities, particularly those relying on large seasonal workforces for harvesting and field operations.
4. Adaptation Strategies by Region and Commodity Group
Table 3 reports farmers’ adaptation strategies in response to immigration-related labor losses by region (see the top panel of Table 3). Across the full sample, relatively few farmers reported making adjustments in response to enforcement-related labor losses. Statewide, 2 percent of respondents turned to a farm labor contractor (FLC) to address enforcement-related labor scarcity, while another 2 percent reduced production. An additional 1 percent reported maintaining normal production levels with fewer workers. To retain incumbent employees, 2 percent of farmers offered new incentives, and 1 percent utilized the H-2A visa program to recruit replacement workers.
Among farmers who experienced labor losses due to either direct or potential off-farm or indirect immigration enforcement activities, those in the North Coast region reported the highest level of adjustment. Sixteen percent of farmers in this region made at least one change to their production or labor management practices in response to enforcement-related labor losses, indicating a relatively high degree of operational adaptation. The most common adjustment was offering new incentives to retain workers (5 percent), followed by the use of FLCs (4 percent) and reductions in production (4 percent). By contrast, farmers in the Desert region reported the lowest rate of adjustment and did not report any use of FLCs, relying instead on a narrower set of responses, including reduced production (1 percent), offering new incentives (1 percent), and use of the H-2A visa program (1 percent).
Farmers in the Central and South Coast region reported the second-highest rate of adaptation, with 10 percent making at least one adjustment to offset immigration enforcement-related labor losses. Given that 20 percent of farmers in this region reported labor losses, this suggests that roughly half adopted an observable adjustment strategy. The most common response was maintaining production with fewer workers (3 percent), followed by the use of FLCs (2 percent), reducing production (2 percent), offering new retention incentives (2 percent), and utilizing the H-2A visa program (2 percent).
In the Central Valley, 7 percent of farmers reported making at least one adjustment in response to enforcement-related labor losses. Because 11 percent of farmers in the region reported enforcement-related labor losses, this implies that nearly two-thirds of the affected farmers adjusted their production or labor management practices. The most common strategies included the use of FLCs (2 percent), reducing production (1 percent), and maintaining production with fewer workers (1 percent). Fewer than 1 percent of farmers reported offering new retention incentives or turning to the H-2A visa program, suggesting more limited reliance on these strategies relative to other regions.
Adjustments also varied across commodity groups (see bottom panel of Table 3). These differences should be interpreted as short-run responses to immigration enforcement rather than long-run adjustments. Production flexibility varies substantially across agricultural commodities. Perennial crops such as grapes and tree fruit require annual maintenance regardless of market conditions, leaving producers with relatively few opportunities to reduce labor demand in the short run. By contrast, livestock and dairy operations generally have greater operational flexibility to adjust production intensity or herd management practices over relatively short time horizons, which may help explain the observed differences in adaptation across commodity groups.
Grape producers reported the highest rate of adaptation, with 15 percent making at least one adjustment in response to immigration enforcement-related labor losses. Given their comparatively high rate of labor loss, this suggests that roughly half of affected grape producers implemented an operational or labor-management response. The most common strategies among grape growers were using FLCs (5 percent) and reducing production (5 percent), followed by offering new incentives to retain workers (3 percent). Smaller shares reported maintaining production with fewer workers (1 percent) or turning to the H-2A visa program (1 percent).
Fruit, vegetable, and ornamental producers reported the second-highest rate of adjustment, with 8 percent adopting at least one adaptation strategy—roughly half the rate observed among grape producers. Their most common response was offering new incentives to retain employees (3 percent), followed by participation in the H-2A visa program (2 percent). Smaller shares turned to an FLC (1 percent), reduced production (1 percent), or maintained production with fewer workers (1 percent), indicating a somewhat broader mix of labor-retention and replacement strategies.
Dairy and livestock producers exhibited a similar rate of adaptation (8 percent), but their adjustment patterns differed. The most common response in this group was reducing production (3 percent), suggesting that scaling back operations was a more prominent strategy than labor replacement or retention. Smaller shares reported using FLCs (1 percent), offering new incentives to retain workers (1 percent), maintaining production with fewer workers (1 percent), or utilizing the H-2A visa program (1 percent).
Producers of other, less labor-intensive crops reported the lowest rate of adaptation (5 percent), consistent with their lower incidence of negative experiences related to immigration enforcement. Among this group, the most common adjustment was turning to FLCs (2 percent), followed by maintaining production with fewer workers (2 percent) and reducing production (1 percent). None reported offering new incentives to retain workers or using the H-2A visa program, suggesting relatively limited demand for more intensive labor adjustment strategies.
5. Conclusion
The findings from this survey provide timely evidence that immigration enforcement affects California agriculture in ways that extend well beyond direct workplace enforcement. Because the evidence is based on employers’ reports rather than direct surveys of farmworkers, the findings regarding worker anxiety and fear should be interpreted as producers’ perceptions of workforce conditions rather than direct measures of employee sentiment.
Although on-farm immigration raids or direct enforcement actions were exceedingly rare among surveyed producers, the broader enforcement climate, including off-farm enforcement or fear of apprehension generated meaningful labor market disruptions. Approximately one in four farmers reported at least one negative consequence tied to immigration enforcement, including labor losses, operational disruptions, or heightened anxiety among workers and employers. These effects were concentrated in labor-intensive agricultural systems and in regions where production depends heavily on seasonal immigrant labor, underscoring the importance of workforce stability for maintaining farm productivity and operational continuity.
The results also show that farmers respond to labor disruptions in diverse ways, but adjustment options are uneven and often limited. Some producers turned to farm labor contractors, retention incentives, or the H-2A program, while others reduced production or attempted to maintain output with fewer workers. These adaptation patterns varied substantially by region and commodity type, reflecting differences in labor intensity, perishability, and operational flexibility. Taken together, the findings suggest that immigration enforcement can affect agricultural producers, even in the absence of direct farm-level intervention.
An important caveat is that if the producers most exposed to immigration-related labor risks were less likely to participate because of the sensitive nature of the survey, then the reported impacts should be interpreted as conservative estimates, and the true effects of immigration enforcement on California agriculture may be larger than those documented here.
Acknowledgments
Zachariah Rutledge and Myat Thida Win are grateful for support from the US Department of Agriculture’s Office of the Chief Economist (award numbers 58-0111-23-002 [Responding to Rising US Farm Labor Costs] and 58-0111-25-017 [Immigration Enforcement and Farm Labor]). The views expressed are those of the authors and do not necessarily represent the views or policy of the US Department of Agriculture or the US government.
AI Disclosure
In preparing the manuscript, we used OpenAI solely to improve writing clarity and organization; it was not used for data collection, analysis, or interpretation. All AI-assisted edits were reviewed and verified by the authors, who take full responsibility for the final manuscript.
Human Subjects Disclosure
This study involves human subjects research and was approved by Michigan State University’s Institutional Review Board (IRB Identification Number STUDY202500717).
It is important to note that the survey captures employers’ perceptions of their employees’ experiences and reactions to immigration enforcement rather than workers’ self-reported attitudes. Consequently, measures of employee anxiety, fear, and enforcement-related labor losses should be interpreted as reflecting farmers’ observations and perceptions, which may differ from workers’ own experiences.