1. Introduction
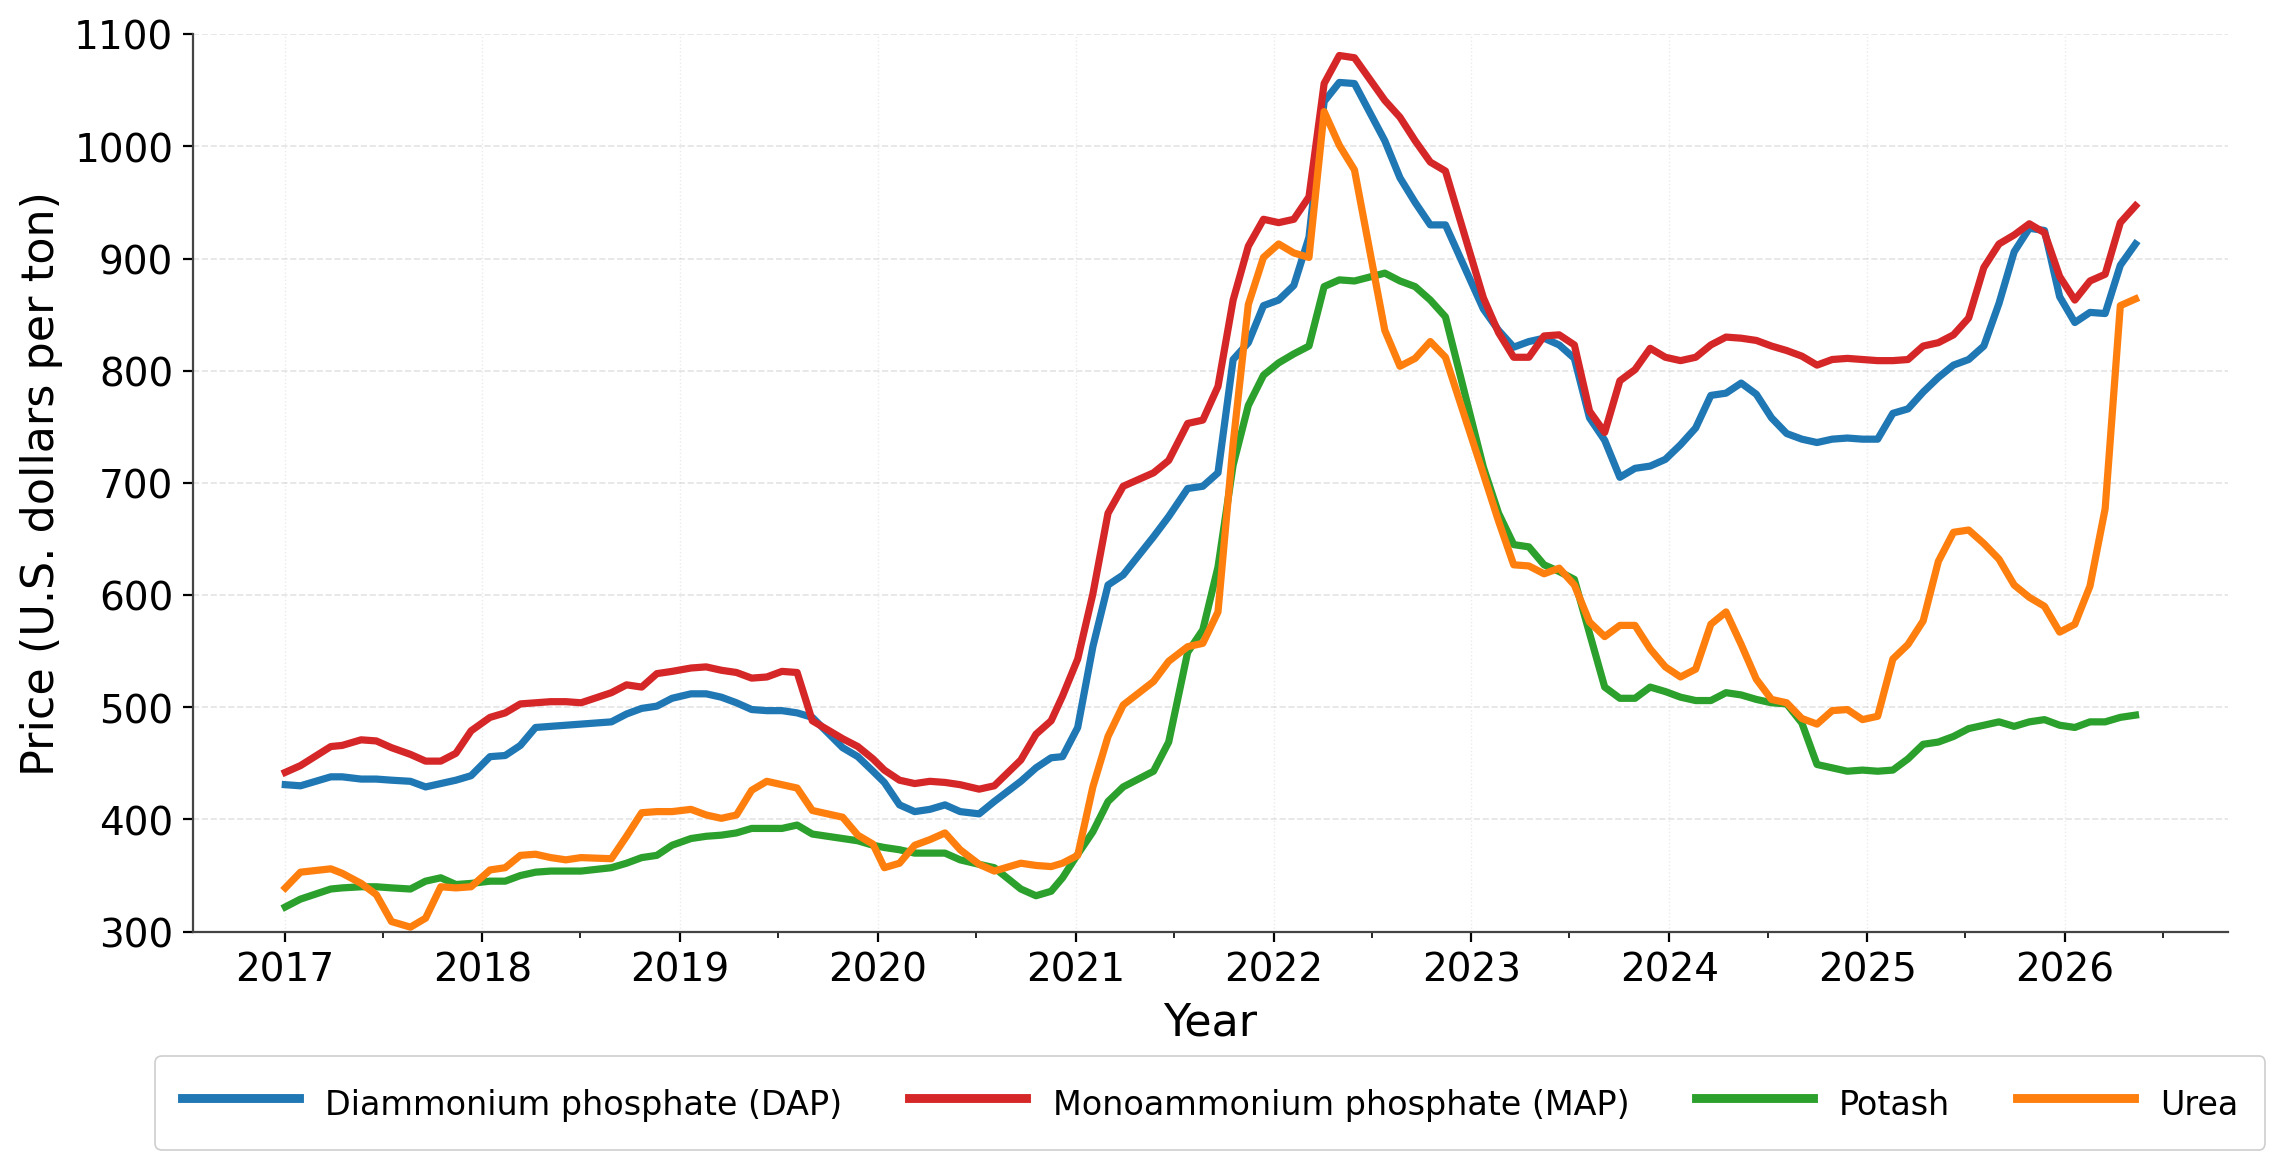
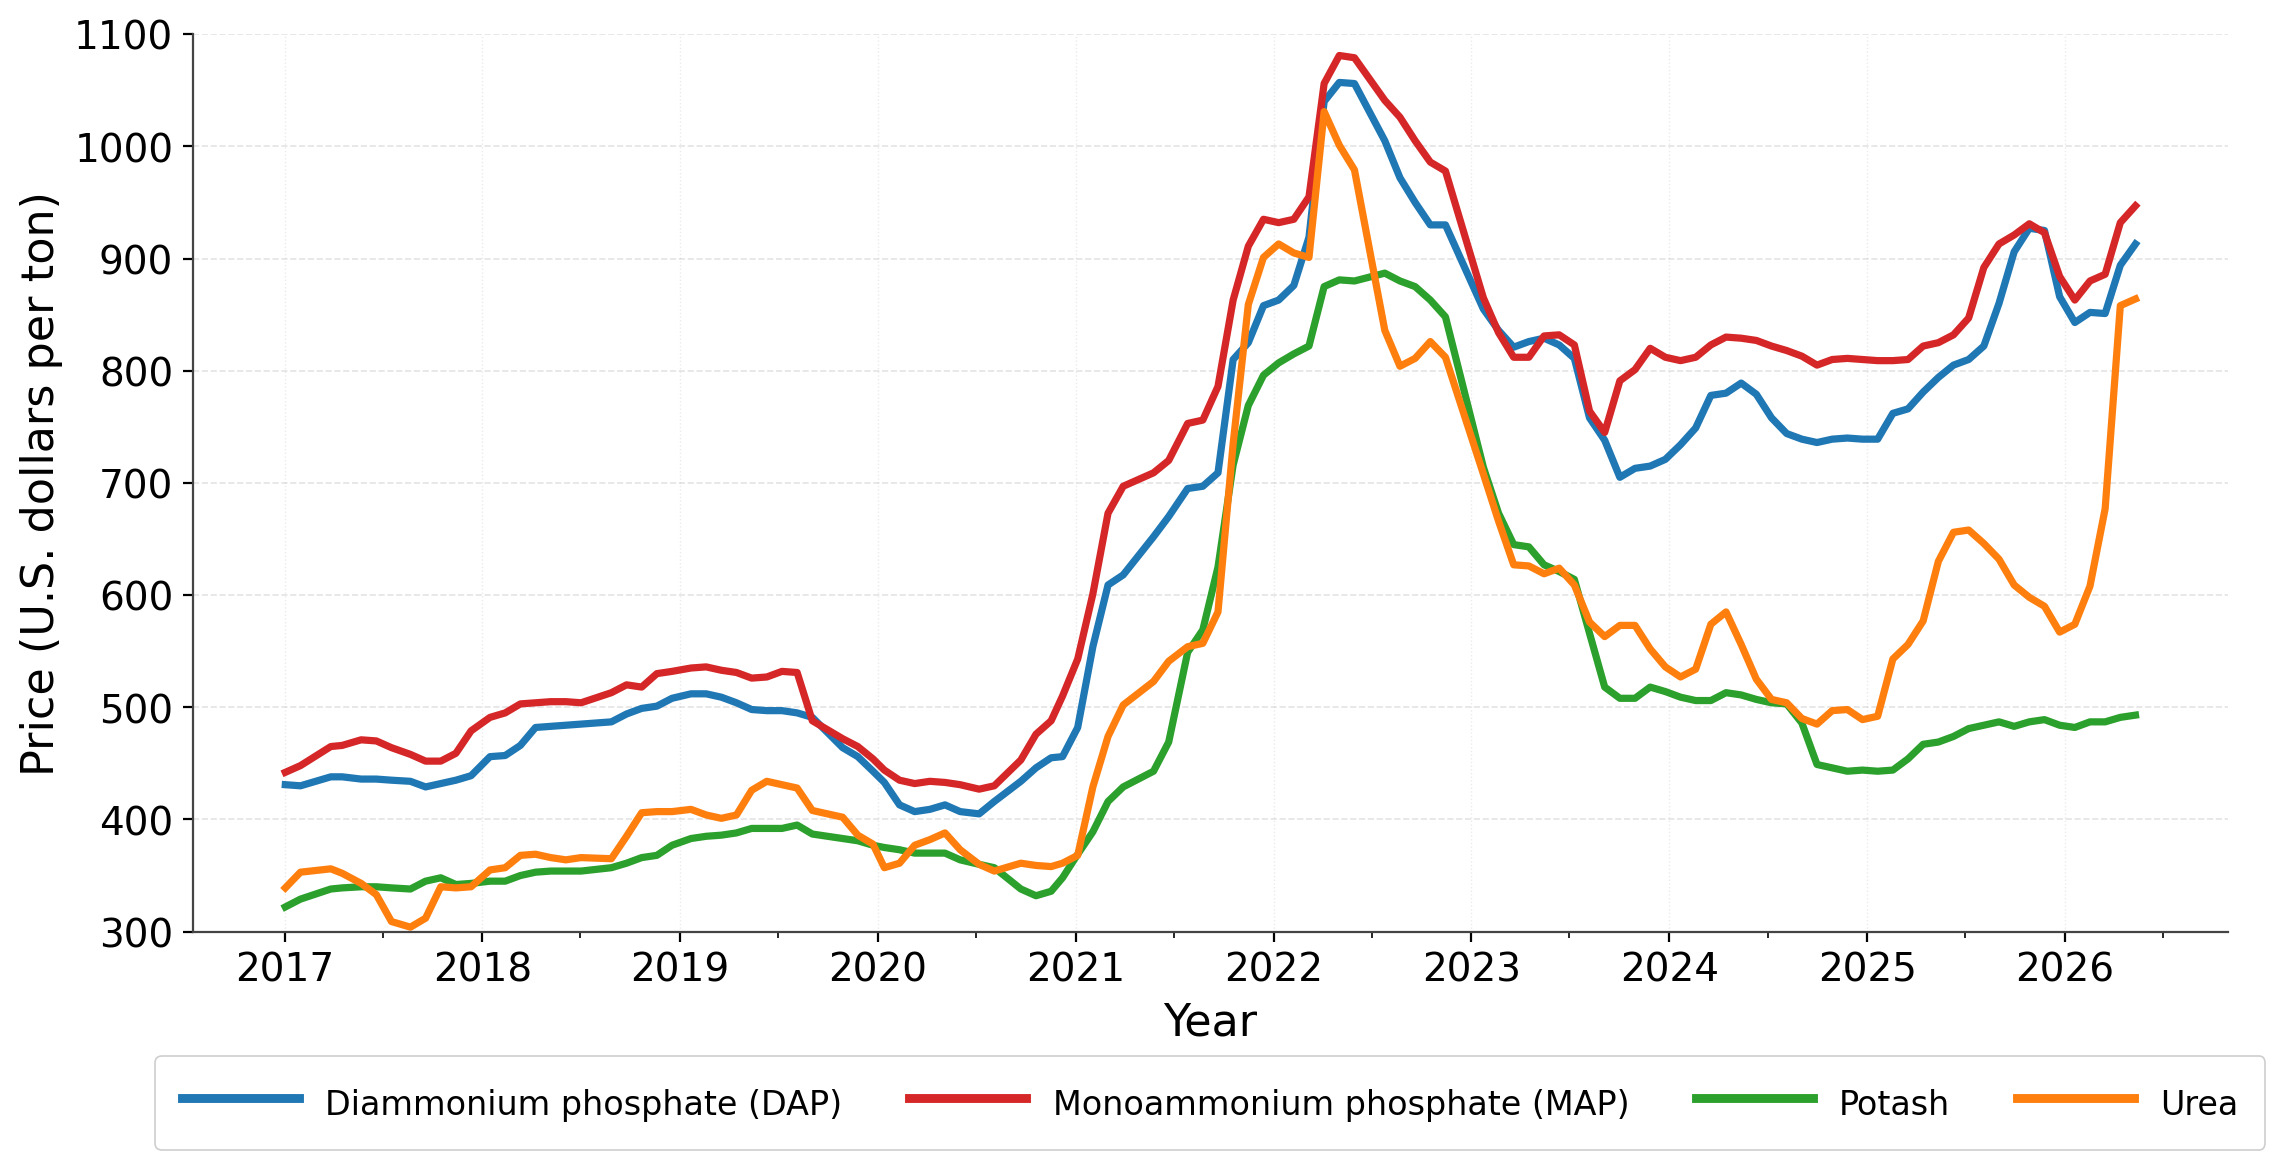
Global fertilizer markets have experienced pronounced volatility and overall higher price levels in recent years. Prices rose to unprecedented levels in 2022 (Figure 1), driven by COVID-19–related supply-chain disruptions and the outbreak of the Russia–Ukraine war (Kee et al. 2023). Although fertilizer prices declined between 2023 and 2025, they remained well above pre-COVID-19 levels. This downward trend reversed in spring 2026 (Figure 1), when instability in the Middle East and disruptions to shipping through the Strait of Hormuz contributed to another sharp increase (World Bank 2026). This sequence of geopolitical and logistical shocks generated historically high and unpredictable fertilizer prices, intensifying financial pressure on producers and increasing the economic value of strategies that reduce chemical fertilizer use and improve nutrient-use efficiency (Williams et al. 2025).
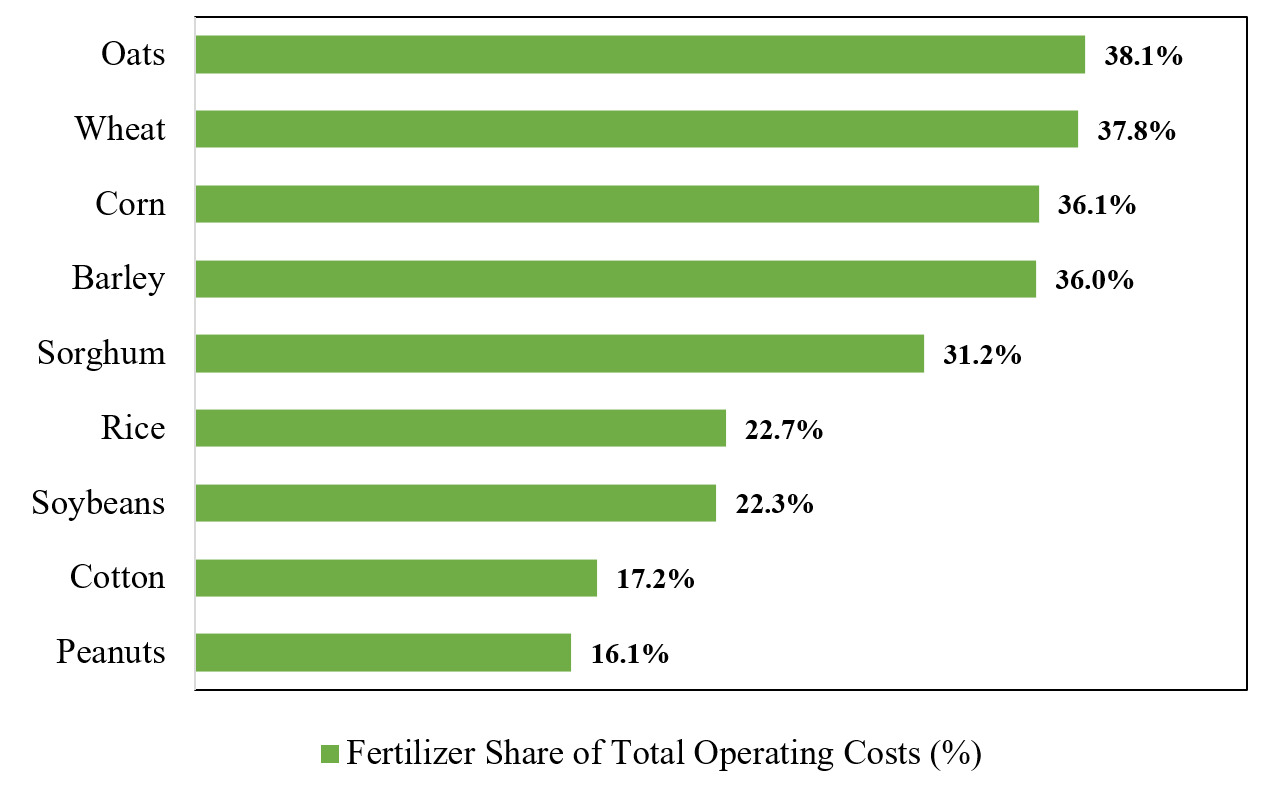
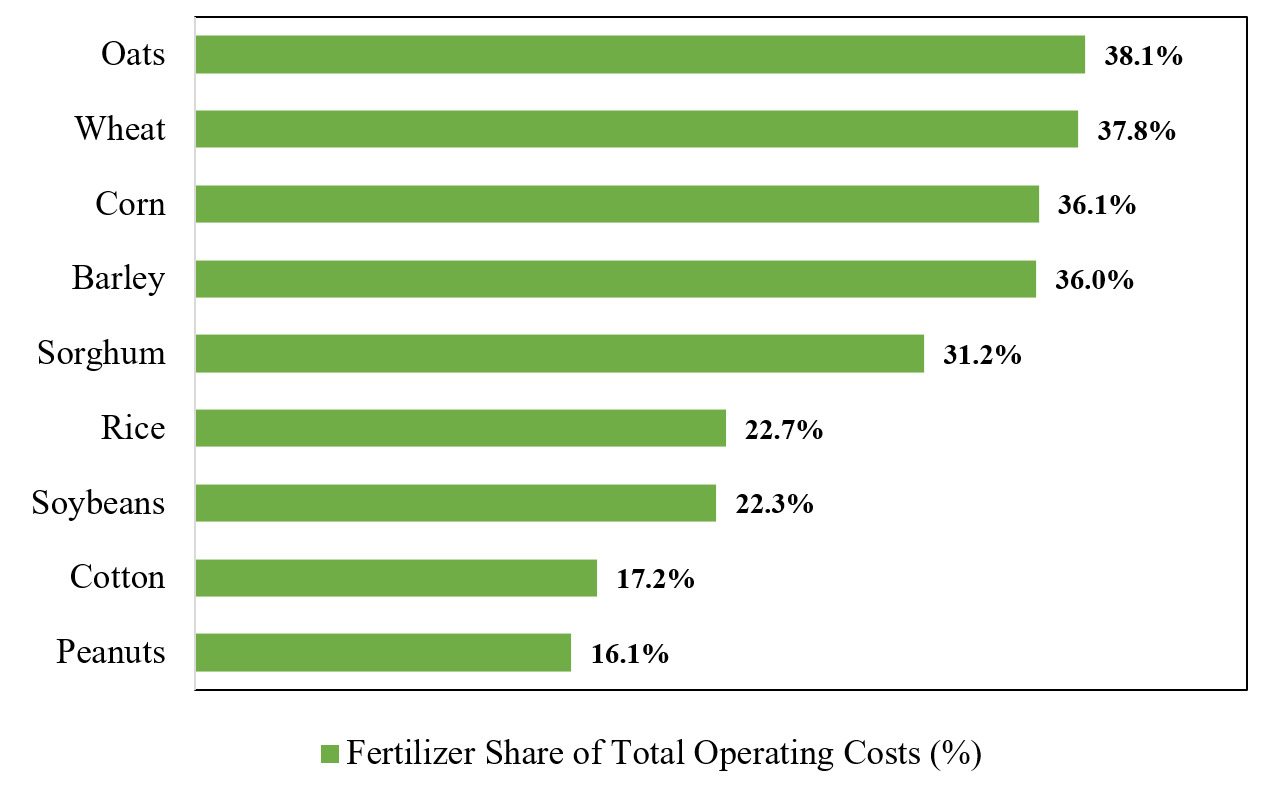
Fertilizer constitutes a major operating expense in US crop production, accounting for nearly 40 percent of total operating costs for corn, barley, wheat, and oats, and more than 20 percent for rice and soybeans in 2025 (USDA-ERS 2026, Figure 2). Under conditions of sustained price volatility, producers face stronger incentives to adopt practices that reduce reliance on conventional synthetic fertilizers while maintaining soil productivity. A growing portfolio of complementary nutrient inputs—including slow-release fertilizers, organic nutrient sources, biochar, and soil microbial products—offers multiple pathways for improving nutrient-use efficiency (T. Wang et al. 2023; Ying et al. 2025). Many of these products enhance nutrient retention, improve soil structure, or provide more gradual nutrient release, thereby increasing production efficiency in volatile input markets (Trenkel 2010; Hossain et al. 2020).
Despite the growing interest in and availability of complementary nutrient inputs, no study has examined farmers’ adoption rates or intensity of use for these practices. This article addresses this gap by providing the first empirical evidence on how producers incorporate complementary nutrient inputs into their fertilizer programs. Using data from a 2025 farmer survey in eastern South Dakota, the analysis documents adoption patterns and usage intensity in a region dominated by corn–soybean production, where chemical fertilizers remain the standard inputs.
2. Advantages and Limits of Complementary Nutrient Inputs
Table 1 summarizes the main advantages and limitations of four complementary nutrient inputs. We then assess how these inputs may be integrated within existing fertilizer management strategies.
2.1. Slow-Release Fertilizer
Slow-release fertilizers, also known as controlled-release fertilizers, contain the same nutrients as conventional fertilizers. Their sulfur or polymer coatings slow the release of nitrogen (Trenkel 2010), better matching nitrogen availability with crop needs, improving nutrient use efficiency, and reducing losses (Mandal et al. 2025). Despite higher upfront costs, slow-release fertilizers often increase nitrogen use efficiency and raise yields (Mandal et al. 2025). They can also reduce labor and machinery costs by lowering the number of applications required (Vejan et al. 2021).
However, the environmental persistence of synthetic polymer coatings is an increasing concern, as these materials can degrade into microplastics that accumulate in soils and may enter aquatic systems (Bhattacharjee et al. 2025). These risks cast doubt on the long-term sustainability of slow-release fertilizers and underscore the need for biodegradable coating technologies.
2.2. Organic Fertilizer
Organic fertilizers come from plant and animal materials, and animal-based sources generally improve soil nutrients more than plant-based amendments (Li et al. 2021). They improve yield, strengthen soil structure, help the soil retain water and nutrients, and reduce losses from leaching and erosion (Sahu et al. 2024; Ren et al. 2025). These benefits often take time to appear, so farmers commonly pair organic fertilizers with inorganic fertilizers for a faster response. Long-term field experiments show that combined applications sustain or increase yields more effectively than either input alone (J. Wang et al. 2025).
While chemical fertilizers supply nutrients immediately, nutrients from organic fertilizers take much longer to become plant-available (Silva 2018). Only 3–5 percent of nitrogen in organic fertilizers is available at application, and further release depends on microbial activity, soil type, and environmental conditions (LSU AgCenter, n.d.; de Jesus et al. 2024). Their low nutrient grade also means farmers must apply large quantities, which increases transportation, storage, and field-application costs. These constraints limit their feasibility at scale, especially in areas where organic inputs are scarce (Brempong and Addo-Danso 2022).
2.3. Biochar
Biochar functions primarily as a soil amendment that improves soil structure, nutrient retention, and long-term carbon storage. Rather than acting as a direct nutrient source, it strengthens—rather than replaces—other nutrient inputs (Glaser et al. 2015). This complementary role is reflected in field results: Adding biochar to compost increased maize yields by 26 percent compared with compost alone (Glaser et al. 2015). Biochar-coated fertilizers can also reduce nitrogen losses from leaching and volatilization by up to 35 percent relative to conventional fertilizers (Guo et al. 2025). By reducing these nutrient losses, biochar improves fertilizer use efficiency and can lower long-term fertilizer needs (Hossain et al. 2020).
Biochar works best in degraded, coarse-textured, or acidic soils, but it can create nutrient imbalances in alkaline soils—making soil testing important before use (Salem et al. 2019; Dai et al. 2020). Its benefits also appear slowly: Yield gains usually show up only after soil organic matter and nitrogen mineralization improve, with few or no short-term gains (Jaufmann et al. 2025).
2.4. Microbes/Biofertilizer
Biofertilizers help rebuild soil microbial diversity and activity lost after decades of heavy chemical fertilizer use. They add beneficial microorganisms that improve nutrient cycling and support plant nutrient uptake (Suyal et al. 2016). Soil microbes also drive key processes such as nutrient release, disease suppression, and stress tolerance (Ullah et al. 2025). Although biofertilizers do not supply nutrients directly, they can boost nitrogen-use efficiency and root growth, allowing chemical fertilizer rates to drop by 25–50 percent (Adesemoye et al. 2009).
Biofertilizer performance depends heavily on local environmental and management conditions (Atieno et al. 2020). The survival and activity of added microbes hinge on soil moisture, temperature, pH, and interactions with existing microbial communities (Khare and Arora 2014). In dry or stressed soils, microbial supplements often fail to establish, resulting in little or no measurable benefit (O’Callaghan et al. 2022). This variability leads to inconsistent farmer experiences and remains a major barrier to wider adoption.
3. Survey and Data Description
We surveyed 3,134 cash-grain producers in eastern South Dakota from July to September 2025 to document fertilizer use and farm management practices. The region is dominated by corn–soybean production (T. Wang and Wongpiyabovorn 2025), and chemical fertilizers remain the standard inputs (Clark 2023).
Using a modified Tailored Design Method, the protocol included up to four contact waves. All sampled producers first received an advance letter with project information, a link to the online questionnaire, a unique identification code, and a $2 cash incentive. Farmers who did not complete the online survey were mailed a paper questionnaire, followed by a thank-you/reminder postcard and a second paper questionnaire with a prepaid return envelope. Of the original sample, 527 farmers were classified as ineligible due to retirement, death, or undeliverable addresses, resulting in 2,607 eligible contacts. A total of 595 completed surveys were returned, yielding a 22.8 percent response rate.
To assess sample representativeness, we compared respondents’ characteristics with US Census of Agriculture data for eastern South Dakota. The average cultivated land area in our sample (767 acres) was not statistically different from the census estimate of 742 acres Similarly, conservation practice adoption was comparable: respondents reported an average of 29.6 percent of land under no-till, compared with 26.8 percent in the census data
The questionnaire collected detailed information on respondents’ current nutrient-management practices, capturing both the adoption of four complementary nutrient-management inputs—slow-release fertilizer, organic fertilizer, biochar, and biofertilizer—and the extent of their use. Specifically, the questionnaire asked producers whether they applied each of these inputs during the 2024 corn season, the most recent completed growing season at the time of data collection. For producers who indicated adoption in 2024, the questionnaire (see Appendix Table A2) further asked them to report the share of their corn acres treated with each product using five discrete categories (1–20 percent, 21–40 percent, 41–60 percent, 61–80 percent, 81–100 percent). These categorical acreage-share measures allow us to distinguish among experimentation, partial adoption, and whole-farm implementation, providing a structured basis for analyzing adoption intensity and scalability across producers.
4. Adoption Patterns Across Complementary Nutrient Inputs
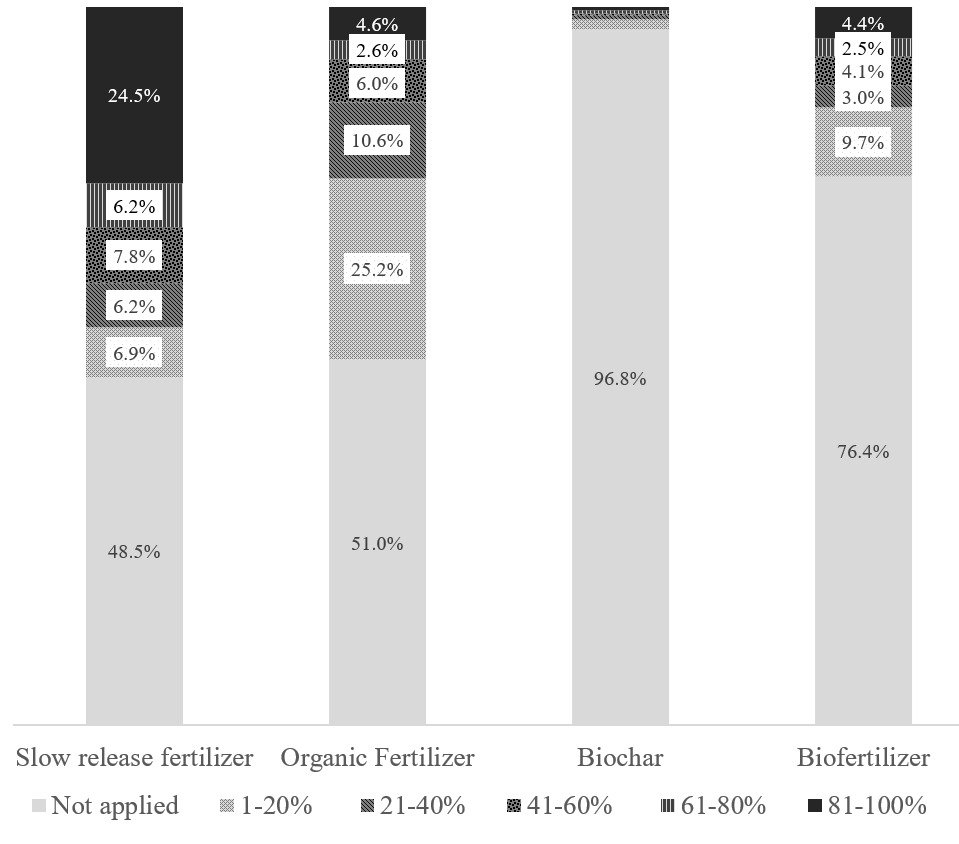
Adoption patterns across the four complementary nutrient inputs reveal pronounced differences in both prevalence and intensity of use (Figure 3). Slow-release and organic fertilizers are the most widely adopted, each used by roughly half of surveyed producers, indicating that farmers are actively exploring options beyond conventional fertilizers. Yet their use profiles diverge sharply. Among slow-release fertilizer adopters, about half apply it on 81–100 percent of their corn acres, signaling broad, whole-farm integration. This high-intensity pattern indicates that slow-release fertilizers have moved well beyond experimental use for a large share of producers. Slow-release fertilizers contain essentially the same nutrients as conventional products, differing primarily in the polymer coating that enables controlled nutrient release (Trenkel 2010; Mandal et al. 2025). Therefore, their rapid expansion and scalability relative to other complementary nutrient inputs is unsurprising, as producers can adopt slow-release fertilizers without additional management complexity.
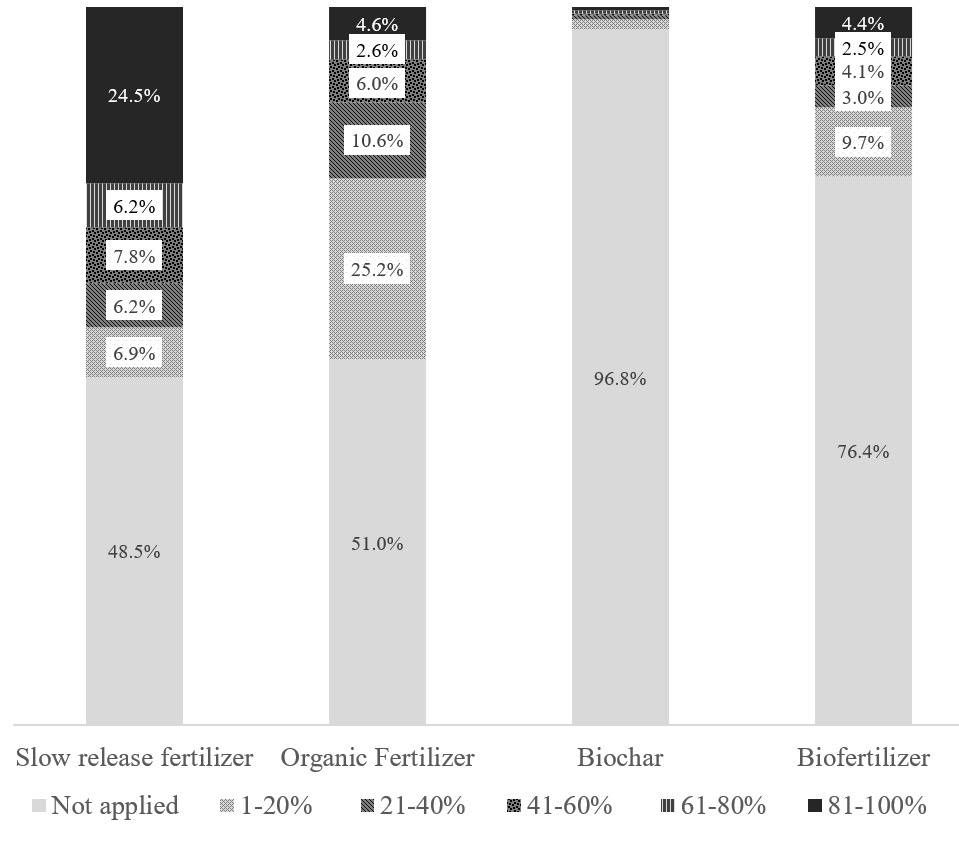
Organic fertilizers exhibit the opposite pattern. Although adoption rates are comparable, most producers apply them to only a small share of their acreage. This limited intensity most likely reflects structural constraints, including the difficulty of sourcing sufficient quantities of organic materials and their lower content of plant-available nutrients (Silva 2018). These constraints reduce the feasibility of whole-farm adoption and instead confine organic fertilizers to targeted, site-specific use, often near livestock operations where they are more readily available.
Nearly one-quarter of farmers (23.6 percent) report using biofertilizers as of 2025, a rate that exceeds the 15 percent adoption documented in similar US regions in 2021 (Oyebanji and Wang 2026), indicating gradual growth over time. Of the 23.6 percent who use biofertilizers, about 40 percent (equivalent to 9.7 percent of all farmers) limit applications to 1–20 percent of their acreage, a pattern consistent with early-stage experimentation. Farmers appear willing to test microbial products and evaluate their performance but have not yet scaled up their applications. This limited integration likely reflects variability in microbial efficacy across different soils and weather conditions, and inconsistent yield responses (Khare and Arora 2014; O’Callaghan et al. 2022).
Biochar adoption is negligible, with only about 3 percent of farmers reporting use. This near-absence of adoption suggests that biochar remains outside the mainstream decision set for most producers. Limited awareness and uncertain agronomic benefits likely contribute to this pattern (Herath Bandara 2025). The extremely low adoption rate indicates that biochar has not yet crossed the threshold from experimental curiosity to a practice farmers consider relevant to their operations.
Patterns of combined adoption provide additional insight into how producers conceptualize these inputs. Based on producers’ reported adoption status for each complementary input, we identified the number of producers adopting every possible combination of the four inputs and summarized these in the percentage column of Table 2. We then decomposed each combination into the four individual input columns, which allowed us to compute the marginal probability of adopting each input (T. Wang et al. 2021). Note that the marginal probabilities in Table 2 correspond directly to the input-specific adoption rates shown in Figure 3, indicating consistency between the joint distribution of adoption choices and the individual adoption measures.
As shown in Table 2, 23.3 percent of farmers used none of the complementary nutrient inputs and relied solely on conventional fertilizers. Among the remainder, nearly 40 percent used only one complementary input, and a similar share adopted two or more. Among farmers who adopted multiple complementary inputs, the most common combination is slow-release fertilizer paired with organic fertilizer, used by 16.0 percent of farmers; an additional 9.2 percent extend this same pairing by also incorporating biofertilizers. Notably, although nearly one-quarter of farmers use biofertilizers, fewer than 3 percent rely on them as the sole complement; most pair them with slow-release or organic fertilizers. The same pattern holds for biochar: no farmer reports using it as the only complementary input. Instead, both biofertilizers and biochar are typically adopted alongside slow-release or organic fertilizers. This clustering indicates that producers view these inputs as complementary components of a broader soil-health strategy rather than substitutes. Farmers motivated to enhance soil biological function or long-term soil structure appear more inclined to adopt multiple inputs simultaneously, consistent with a portfolio approach to managing soil fertility, production risk, and long-term productivity.
5. Cost Comparisons and Nonprice Factors in Fertilizer Decisions
Costs of different nutrient inputs from available sources are summarized in Appendix Table A1. On a per-ton basis, slow-release fertilizer has the highest cost, followed by biochar, then biofertilizer, with organic fertilizer having the lowest cost. However, cost alone does not appear to explain the adoption patterns observed. Organic fertilizer, for instance, has a relatively low per ton cost, yet other nonprice factors—such as low nutrient content—likely constrain its use. In contrast, slow-release fertilizer is more expensive but still widely adopted. Its popularity is likely because it provides essentially the same nutrients as conventional fertilizer in a controlled manner, allowing producers to integrate it easily into existing nutrient-management routines.
These patterns suggest that producers do not make fertilizer decisions based on price factors alone. Because nutrient inputs differ in function, nutrient concentration, sourcing requirements, and perceived reliability, simple price comparisons are not informative. Instead, producers weigh cost alongside other considerations, including certainty in expected benefits, the timing and consistency of nutrient release, and ease of procurement. For inputs such as biochar and biofertilizer, these additional considerations often center on uncertain agronomic benefits and limited producer familiarity, which further shape adoption outcomes.
6. Conclusion
Adoption patterns from the 2025 eastern South Dakota survey show that producers are actively incorporating nontraditional nutrient strategies, but the scalability of these products differs substantially. Slow-release and organic fertilizers have similar adoption status, yet they diverge sharply in usage intensity. Slow-release fertilizers have transitioned into reliable, whole-farm inputs, typically covering most of a farm’s acreage for nearly half of adopters, while organic fertilizers remain acreage-limited, confined to only a small portion (1–20 percent) of the farm for half of their adopters. This contrast underscores the need for investments in regional supply-chain capacity, including manure transport and composting infrastructure, to enable broader use.
These patterns highlight that fertilizer decisions are complex and hinge on factors beyond cost alone. Although slow-release fertilizers are the most expensive input on a per ton basis, their functional similarity to conventional fertilizers and ease of integration into existing routines make them attractive to producers. Conversely, the relatively low cost of organic fertilizers does not translate into broad, whole-farm use because low nutrient content and sourcing constraints limit their scalability. For biofertilizers and biochar, uncertain agronomic benefits, limited familiarity, and variable performance across soils and weather conditions further shape adoption outcomes, consistent with broader evidence on nonprice drivers of input adoption.
Given producers’ tendency to combine multiple nutrient inputs, further research should evaluate whether these products function as complements in improving soil health and nutrient management. If such complementarities are empirically established, then policies would be most effective when structured as integrated, portfolio-based programs rather than single-practice incentives. Designing incentives around complementary nutrient-management practices can provide more effective pathways for reducing producers’ exposure to production and input-price risks while supporting sustained improvements in soil productivity.
About the Authors
Tong Wang is a Professor and Extension Specialist in Advanced Production Economics at the Ness School of Management and Economics, South Dakota State University, Brookings, South Dakota. Tong.wang@sdstate.edu (Corresponding author). Akinsola Oyebanji is a Graduate Research Assistant with Ness School of Management and Economics, South Dakota State University, Brookings, South Dakota. Wajdi Belgacem is a Postdoc Research Associate at the Ness School of Management and Economics, South Dakota State University, Brookings, South Dakota. Lin Wei is a Professor at the Department of Agricultural and Biosystems Engineering, South Dakota State University, Brookings, South Dakota.
Acknowledgments
The authors declare no conflicts of interest. Financial support for this work was provided by USDA-NRCS-CIG (NR233A750011G019) and the US National Science Foundation through the EPSCoR program (Cooperative Agreement No. 2416911).
AI Disclosure
AI tool (Co-pilot) was used only for language editing and grammar checking during manuscript preparation.
Human Subjects Disclosure
This study was approved by the Institutional Review Board (IRB) of South Dakota State University (IRB-2025-88). All participants provided informed consent prior to participation.